FAF Statistics Megathread 2 Statistics Boogaloo
-
The campaign also serves as a tutorial (especially the original SupCom one), but on FAF it gets a little buried. On the play screen, there are usually games custom-marked for noobs, but even those are beyond the skills of someone who is just starting and may be offputting.
Also, there is no obvious button on the starting News screen to play a game. Some people might arrive and immediately get lost.
If there is a way to detect when someone opens FAF for the first time, it might be useful to provide some custom links, much more obvious than usual, to a tutorial level or at least a how-to-navigate-FAF video.
-
Can we get statistics for ban amount, appeal and successrate of the appeal?
-
@Deli I've got this data and made some preliminary graphs, but currently lack the time to work them out properly. It's on to-do list!
-
By @Fichom 's request I looked in some more data today and have some further graphs that look specifically at rating brackets. All of the graphs in this post can be clicked on to zoom in, since I exported them in a fairly decent resolution.
For these graphs the playerbase was split by their global rating in brackets of <500, 500-1000, 1000-1500, 1500-1800, 1800-2000, and >2000.
The first graph plots the number of active players (with at least 10 games played in the past) over time per month, and breaks them up into rating brackets.

Graph 9: Active players with more than 10 games by Global rating bracket per monthYou can clearly recognize the Covid peak on this graph, which then drops down again. The highest rated players are a minority, as can be expected. Zooming in on the last 5 years, we can get a bit of a better look at the smaller populations:

Graph 10: Active players with more than 10 games by Global rating bracket, past 5 yearsIf you look carefully, you may spot that the quantity of high rated players (1800-2000 and >2000) has increased in the past 5 years. Looking at this data when we plot the brackets as a percentage of all players rather than quantity, we can see that the proportion of 2000 rated players has also slightly increased over time.

Graph 11: Active players with more than 10 games by Global rating bracket, as a percentage of total playersIt also is clear from this graph that most players have a rating lower than 1000. For a long time now people have considered players that are rated higher than 1500 to be 'pros', in no small part because Gyle started classifying them as such in his casts. The data doesn't disagree: less than about 10% of the player base is rated higher than 1500. The true professionals rated above 2000 are the top ~1.2% of players.
A cleaner view of the same data is shown in graph 12, where I split the data not by month but by year and plotted the data as stacked bars:

Graph 12: Active players with more than 10 games by Global rating bracket, as a percentage of total players, by year.Looking at this graph, it seems that the population of sub 500 rated players is the smallest it has been since the start of the FAF project. To compare how these proportions change over time I've unstacked the bars in graph 13:

Graph 13: Active players with more than 10 games by Global rating bracket, as a percentage of total players, by year over the past 5 years, unstacked bars.All categories above the 1000 rating seem to have increased somewhat over the past 5 years. Whether this is a sign of rating inflation is something someone smarter than me can argue for. The number of >2000 rated players specifically has increased significantly over time since the lowest number in 2017 however:

Graph 14: Number of >2000 rated players over time
Some further questions by @Giebmasse prompted looking into the number of games played by each bracket over time. Specifically, we were interested to see if 2k rated players, for example, would play significantly more games than could be expected from the number of players in that bracket.
First, looking at how many games were played by each bracket in the past 5 years:

Graph 15: Games played per global rating bracket per year since 2019As expected, the rating bracket with the most players also resulted in the most games played. Most games were played by the 500-1000 rated player group, and the fewest by the >2000 rated group. It is interesting to see how many games were played, however. The games plotted here were only the games from global leaderboard, and at the peak of 2020 well exceeded 3 million games played.
Lastly, graph 16 plotted the number of games per bracket normalized for the number of players in that bracket.

Graph 16: Average games played per player by rating bracket in the past 5 yearsThis graph shows clearly that higher rated players play, on average, more games than lower rated players. This is not unexpected: 2k's do not randomly pop into being, but are the result from continuous 'training' and playing games. While I am sure not everyone can become a high rated player, if you want to give it a try the best way to do so is to play more games. Naturally, the effect also work the other way around: players that are good at the game and enjoy playing it, play more.
Whenever I next have time I intend to have a look at moderation-related data.
-
@IndexLibrorum Awesome job, thank you!
Please make similar stats for 1x1 ladder
-
 S Skrat referenced this topic on
-
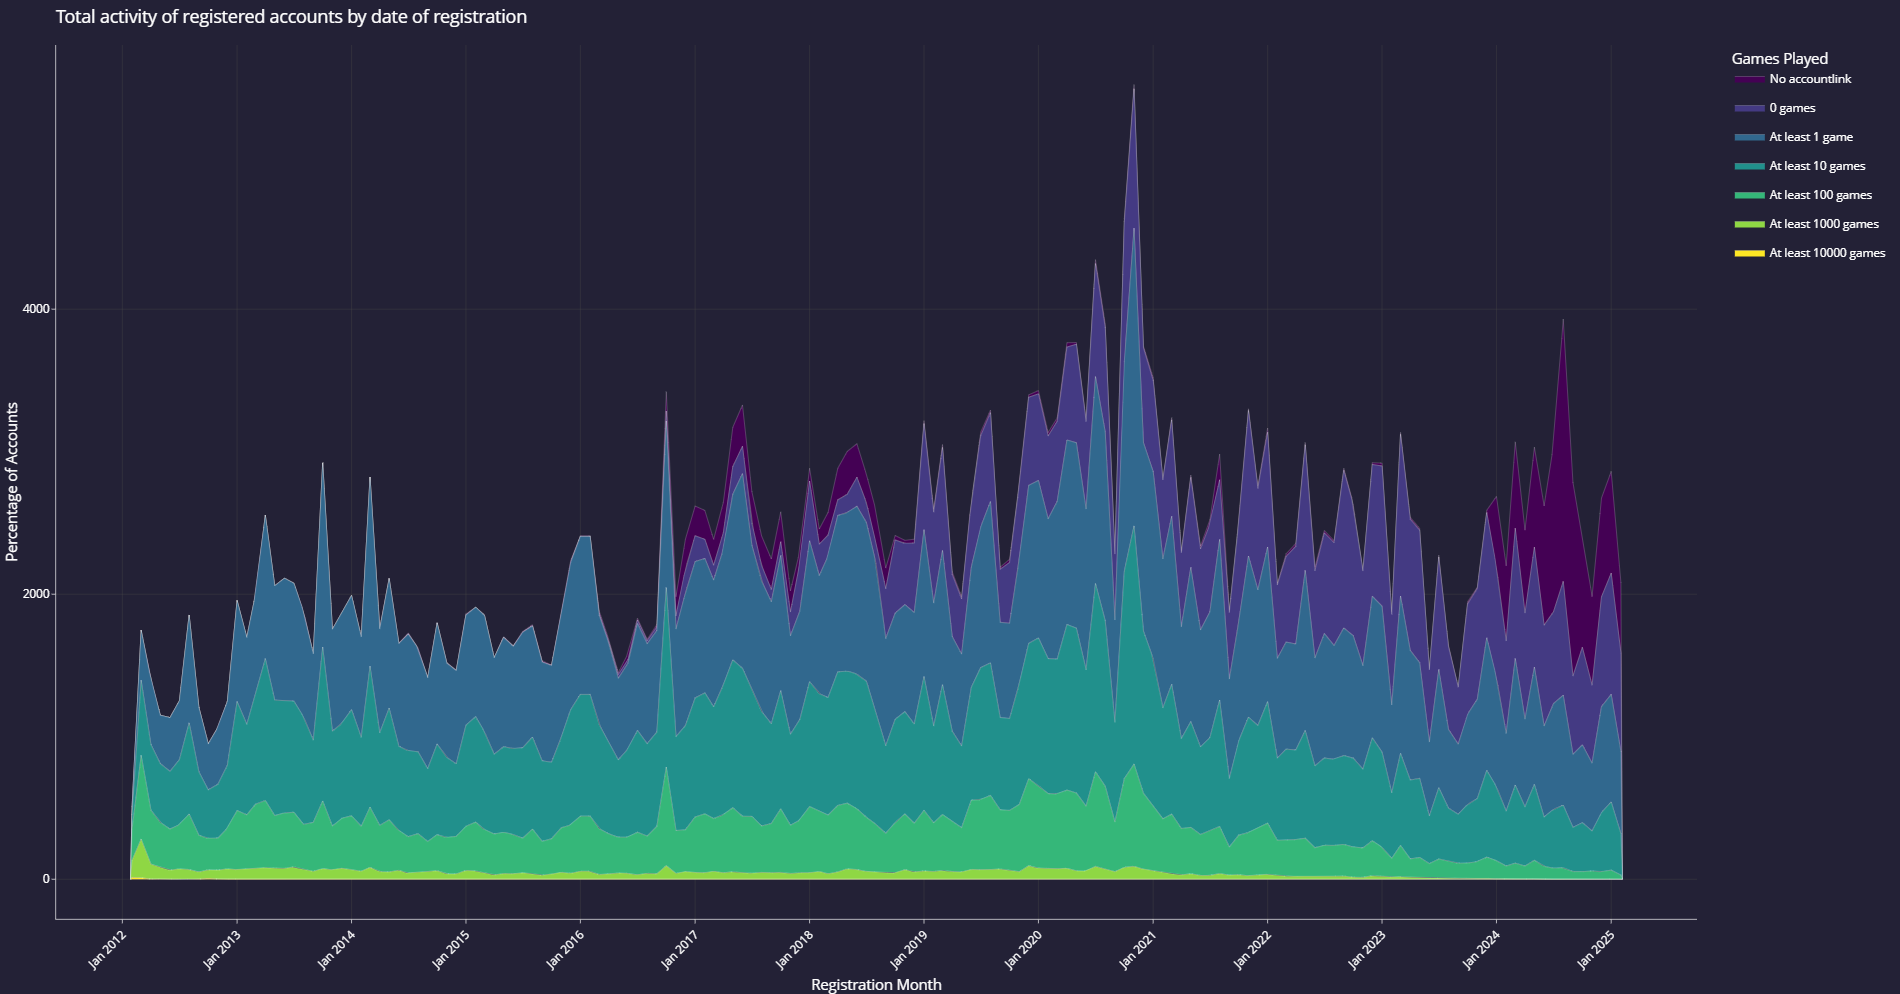
This data is then plotted as absolutely numbers of accounts (first graph)
The Y axis is "Percentage of accounts". What does 2000 percentage of accounts even mean?You've obviously wanted to write "Number of accounts" on this picture, not percentage.
-
@Sainse There's an error here and there in the labels, soz
-
Ranked (rated) FAF stats
Goals and methods
I would like to contribute by providing more graphs focused on competitive gameplay. So all images you are going to see are for rated replays. I've used the same API interface IndexLibrorum had described in the initial post. Thanks to him for helping out with the initial setup.
AI, coop, sandboxes as well as unranked games are excluded from my analysis. Data scope is between 1st January 2017 until 31st July 2025. It's about 23 GB of .json data later converted to .parquet for processing.
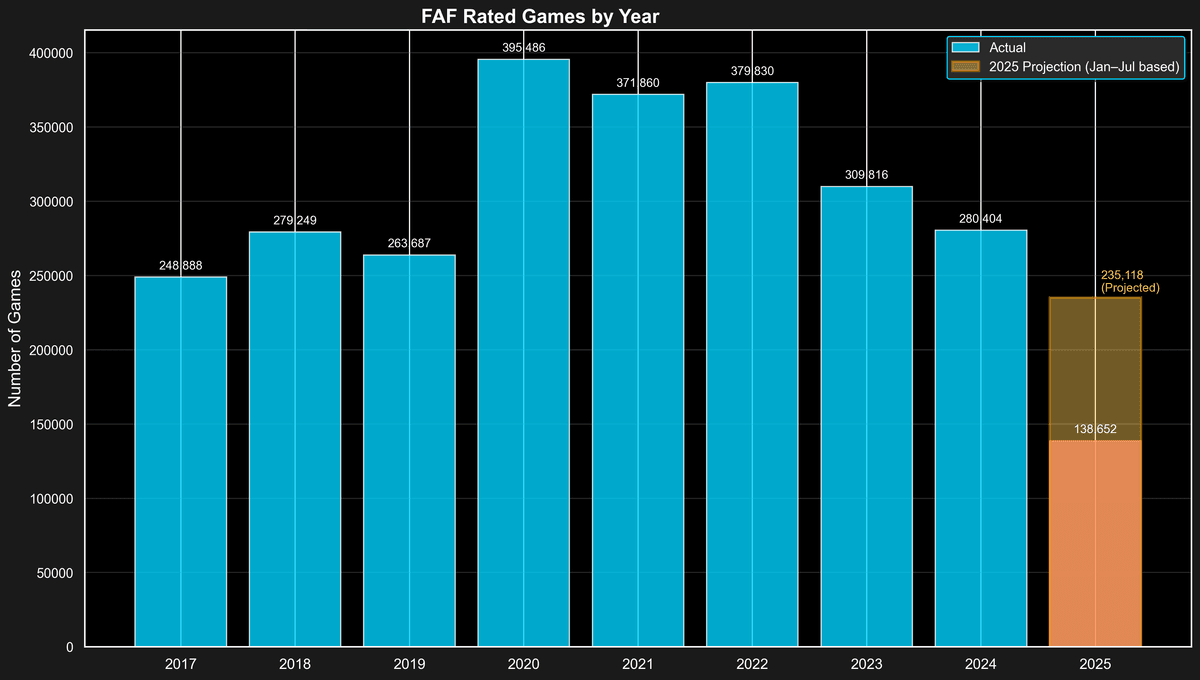
Total number of games
The total number of rated games on a yearly basis ranges between around 250k to 400k. FAF peaked at the middle of pandemic with 395k games played in 2021. In 2025 there has been 138k games played by the end of 31st July. On average around 60-65% rated games are played by this date. That allows to make an approximate projection that by the end of 2025 the amount of rated games should reach about 235k.
Total total numberof all FAF games in 2018-2019 was around 1.25 million. It allows to conclude that around 20% of FAF games are rated. However it does not mean that 80% of FAF is coop/ai/survival, as there are many more reasons for game to not become ranked, such as desync, con issues or being a sandbox game.
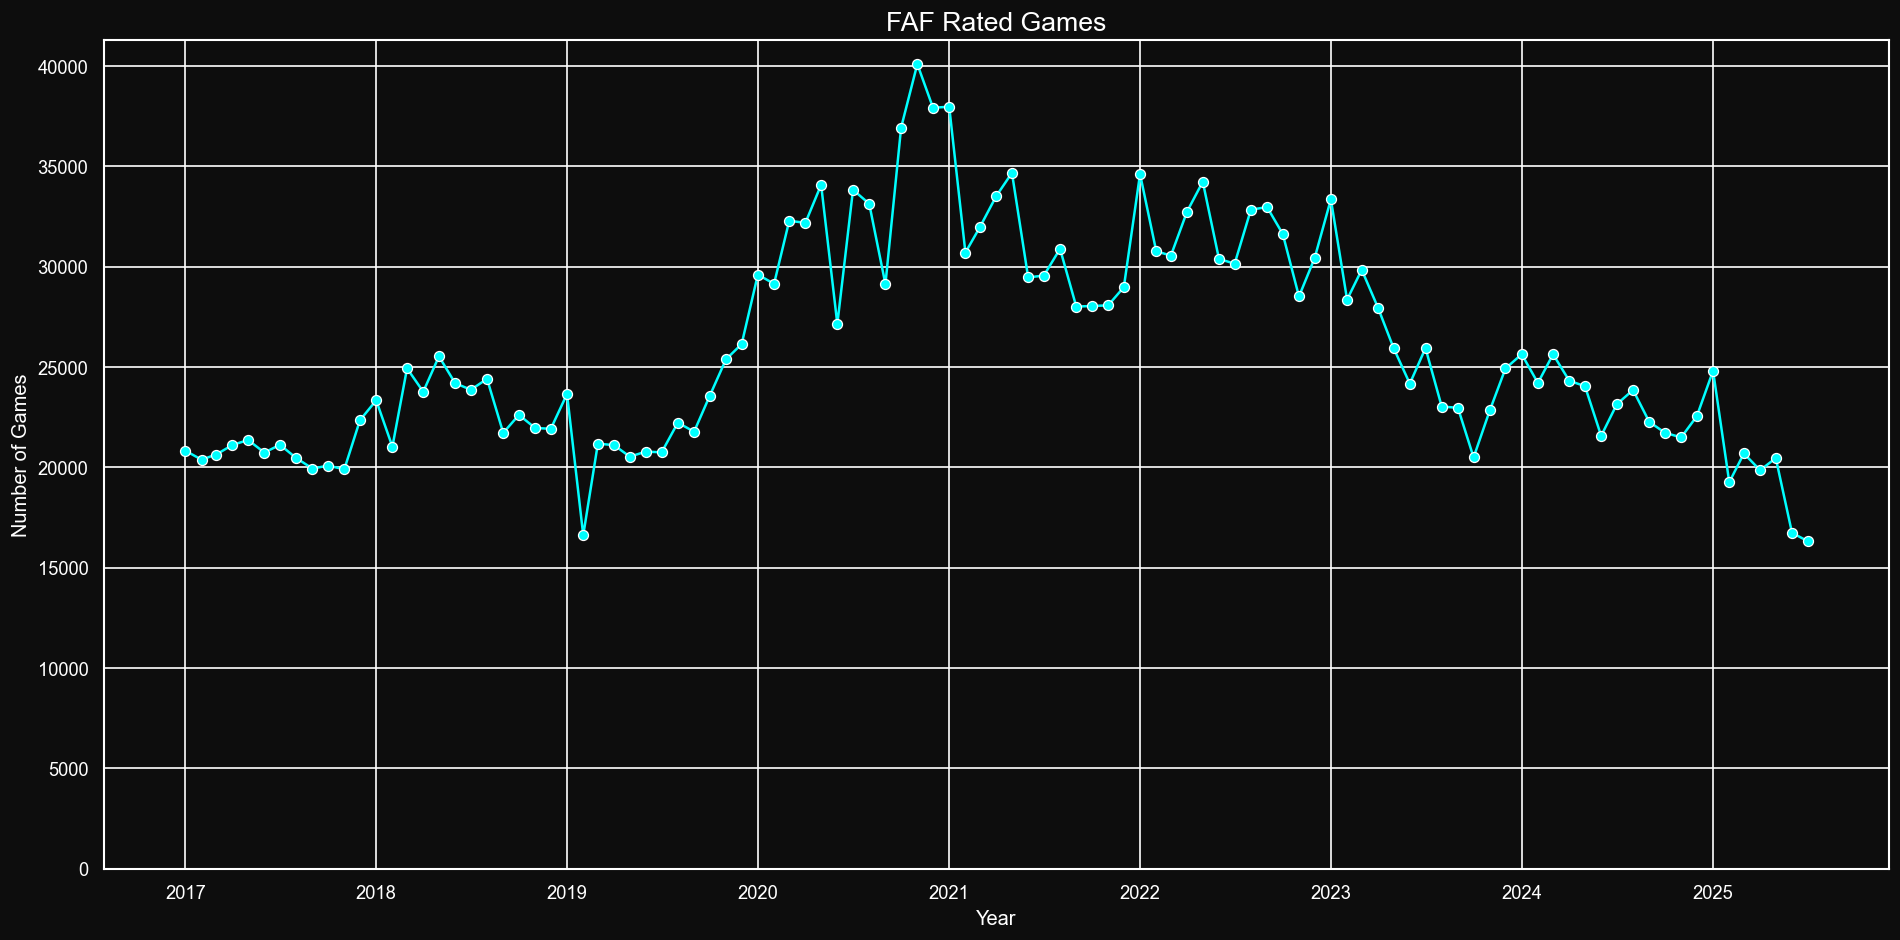
Rated games
The peak year was in 2021, but what about peak month? November 2020 with 40 099 games.
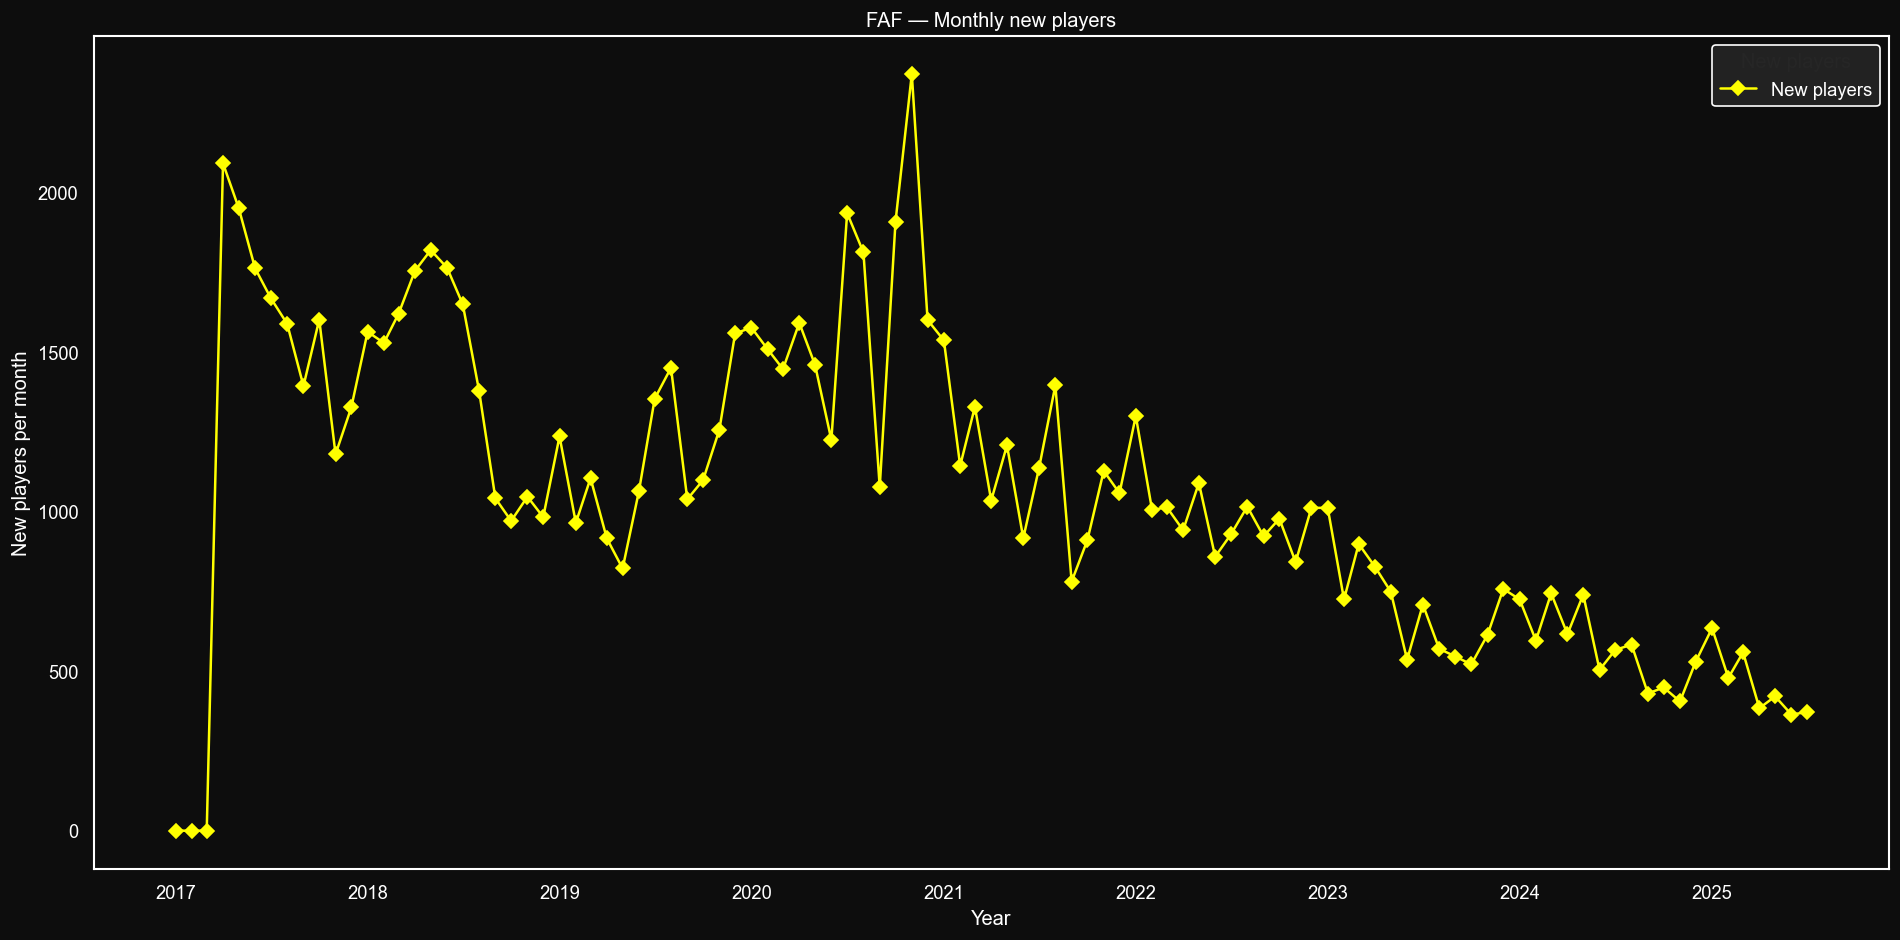
New players
The best way to "zoom in" new players dynamics without downloading pre-2017 data is to consider first 3 months players to be "old" players. This is still not accurate for first 3-6 months, but after that point it better shows ups and downs. You can see that amount of new players somewhat increased between 2020 and 2021, but not drastically if compared to 2018-2019 levels.
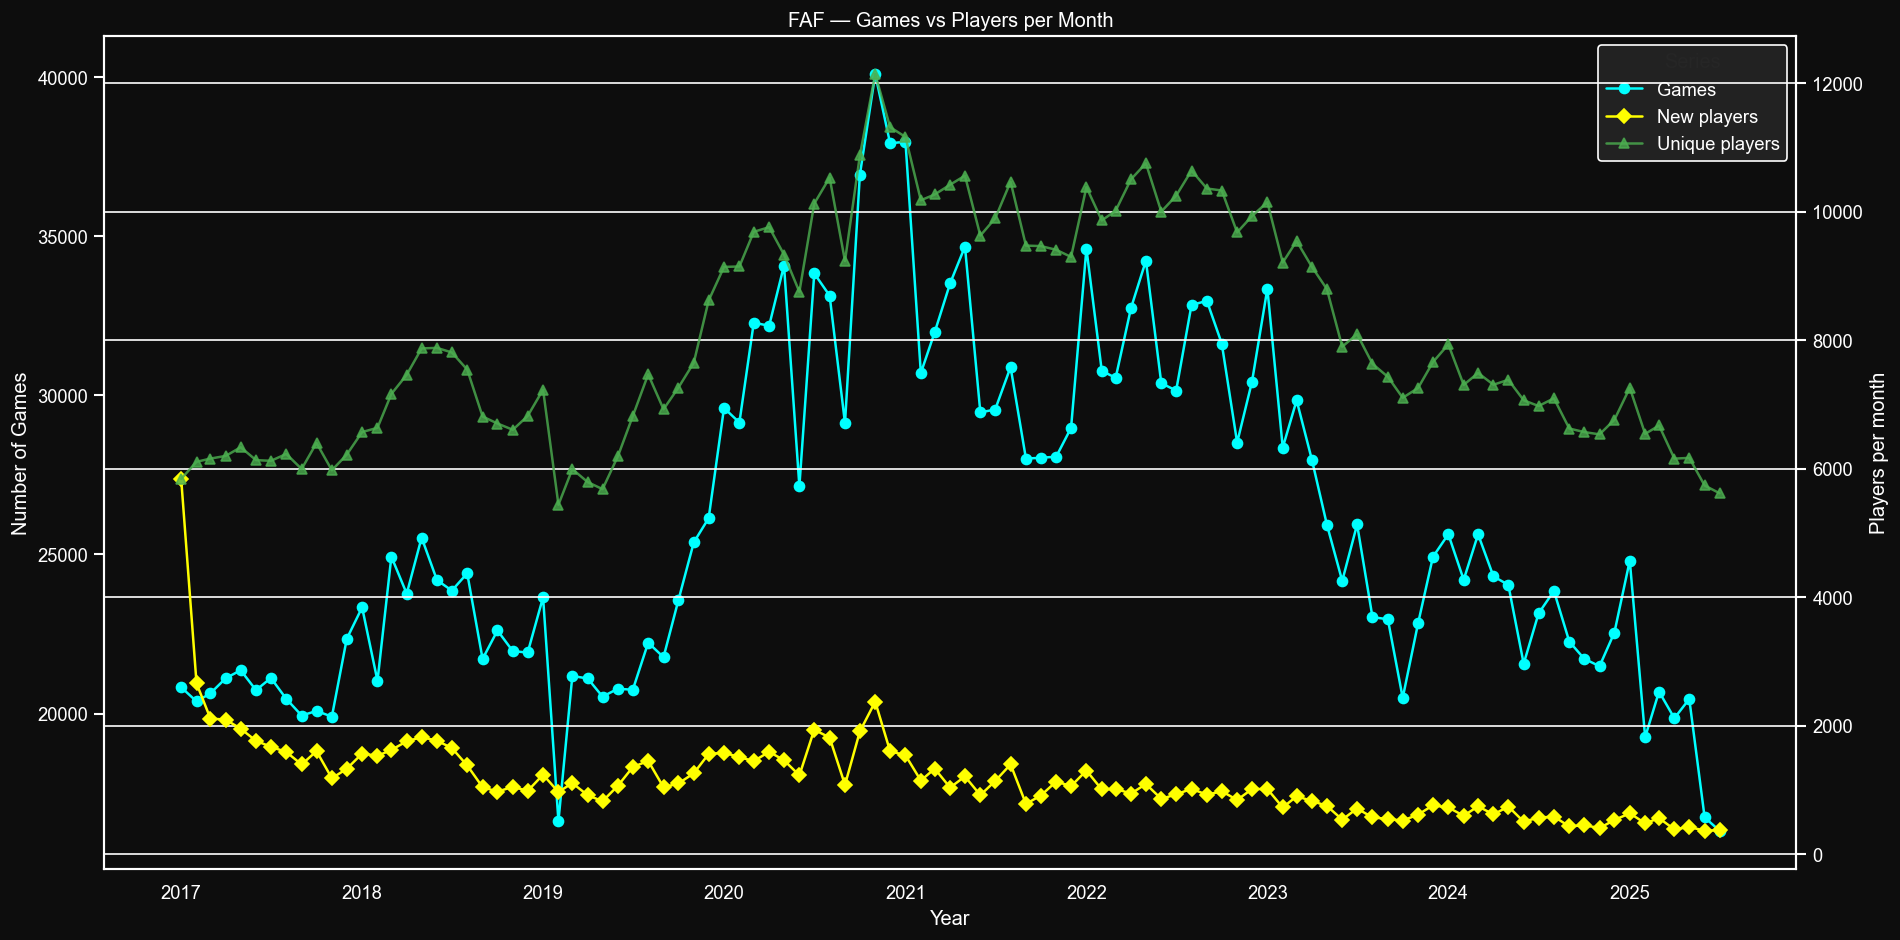
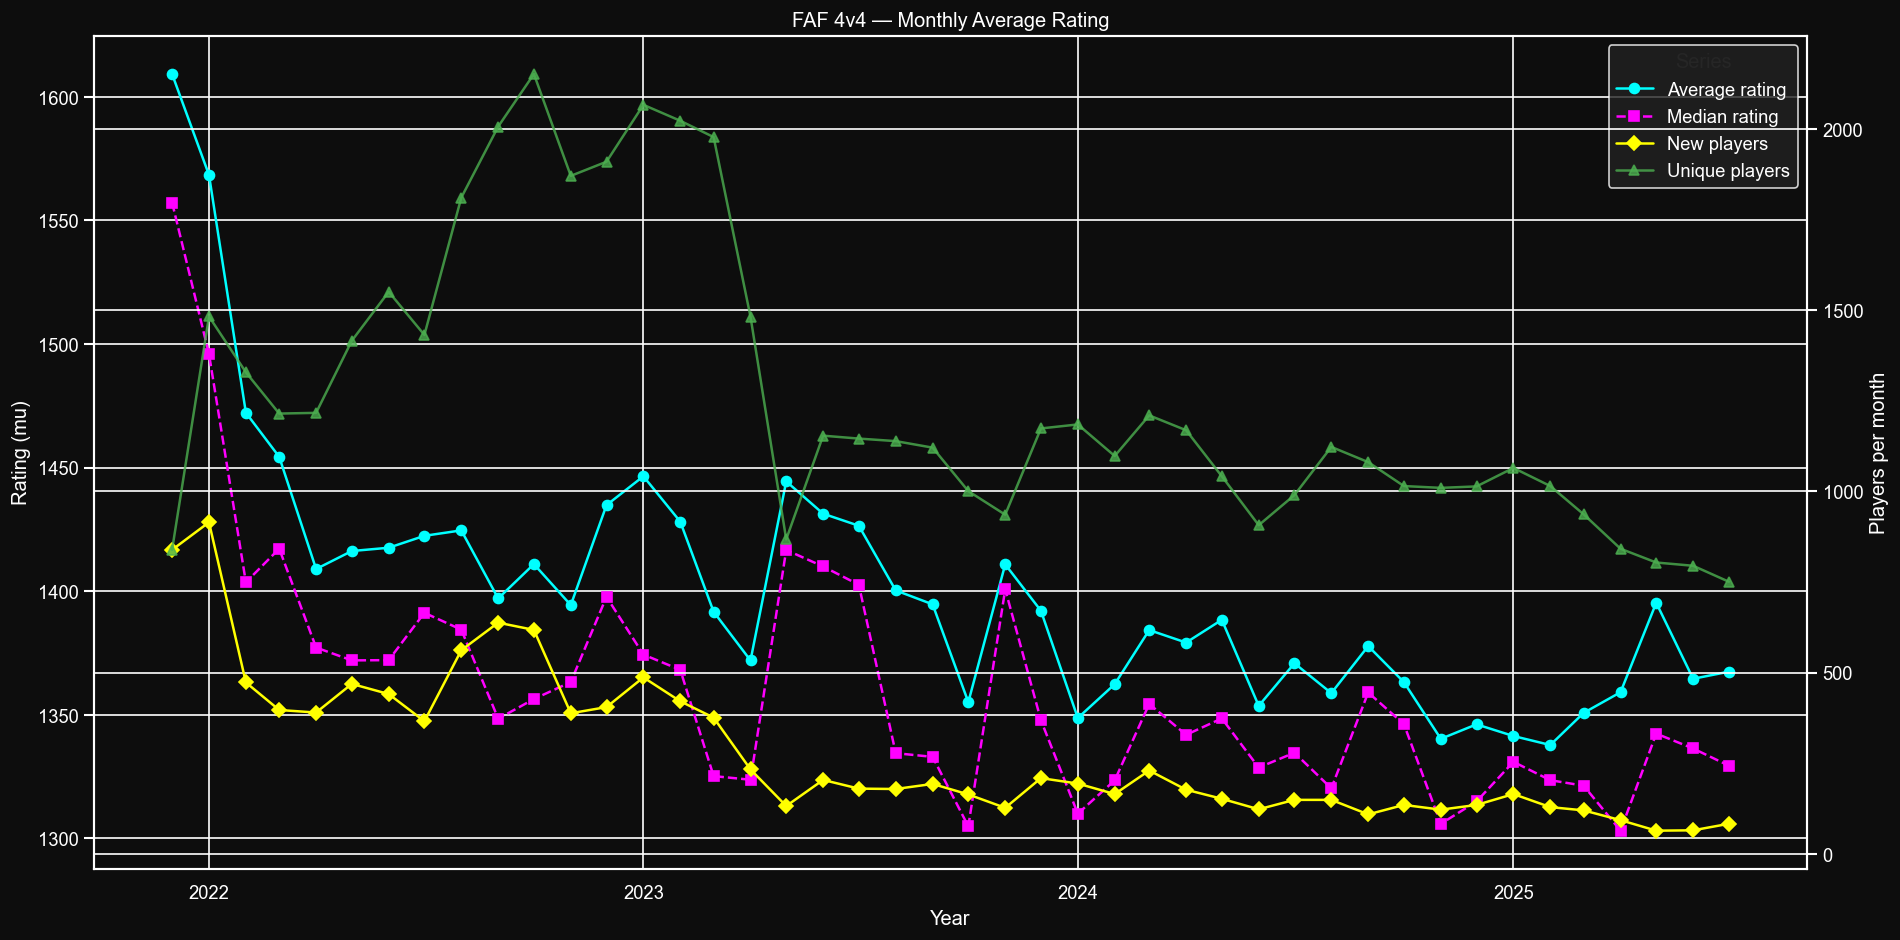
New and unique players
Note that the data points for new players aren't accurate for the first couple of months. The unique players are accurate for the entire image.

Players and ratings
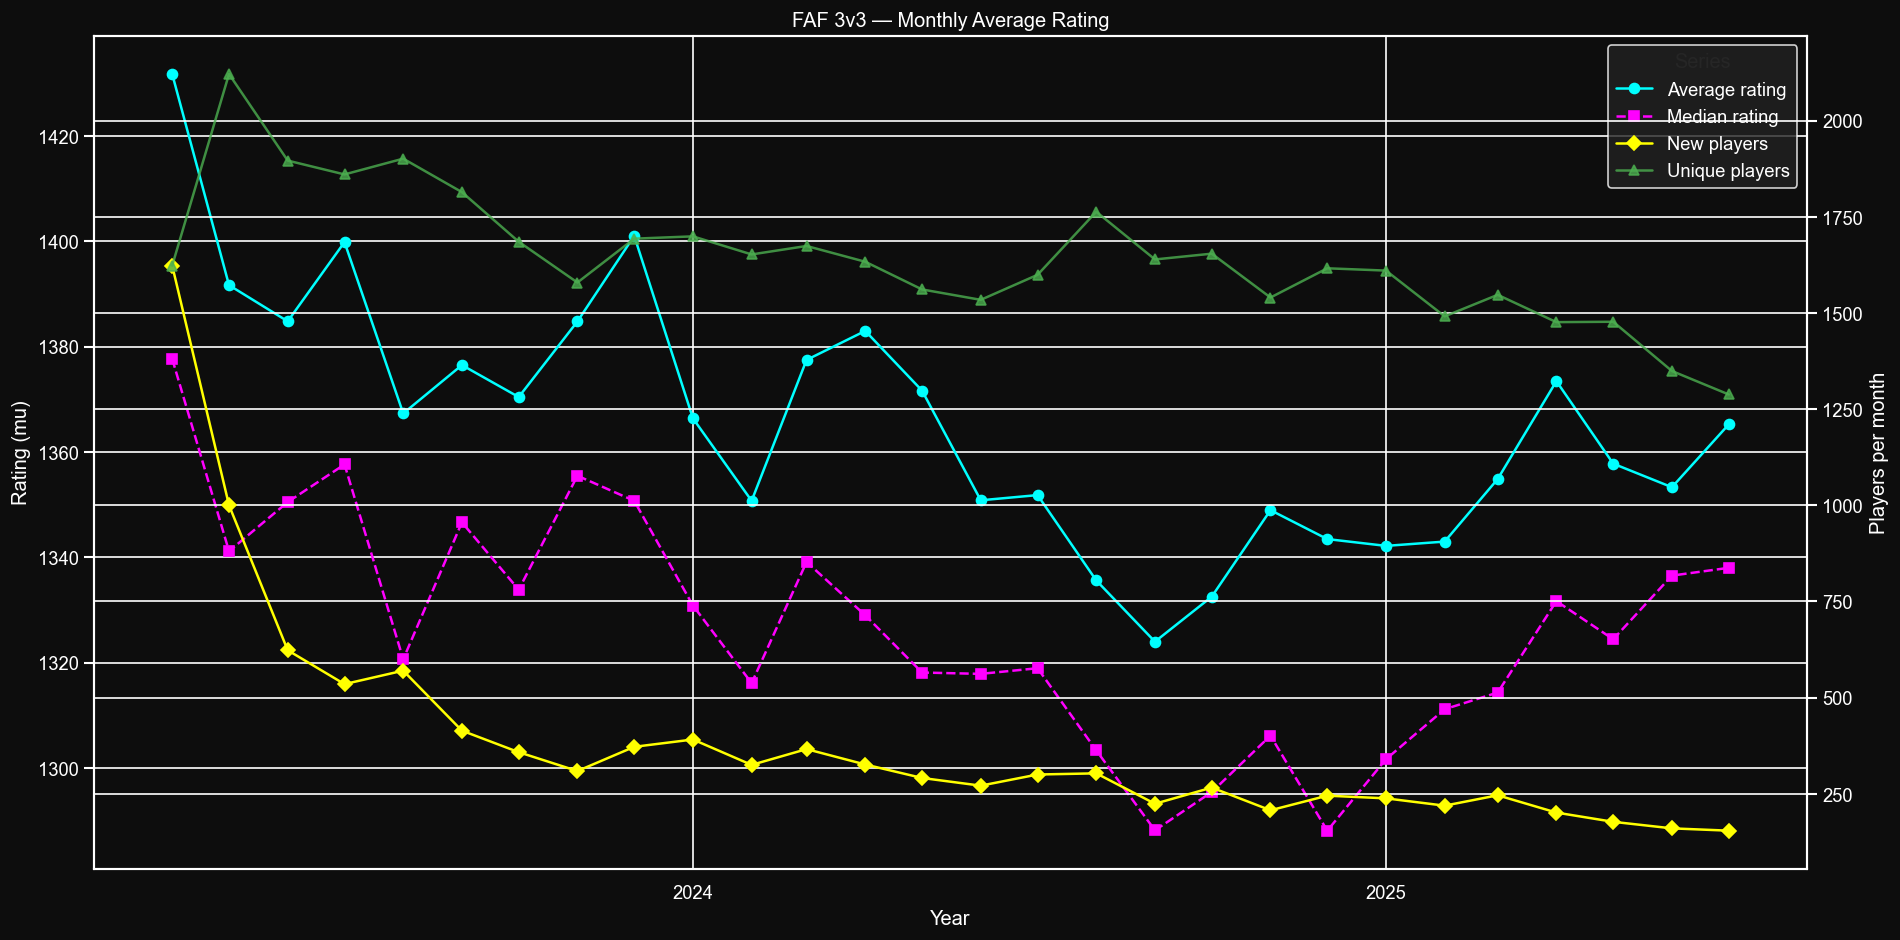
Note that there are two Y-axis. The left one is number of games (tens of thousands and no less than 16k), the right one is amount of new/unique users (thousands).
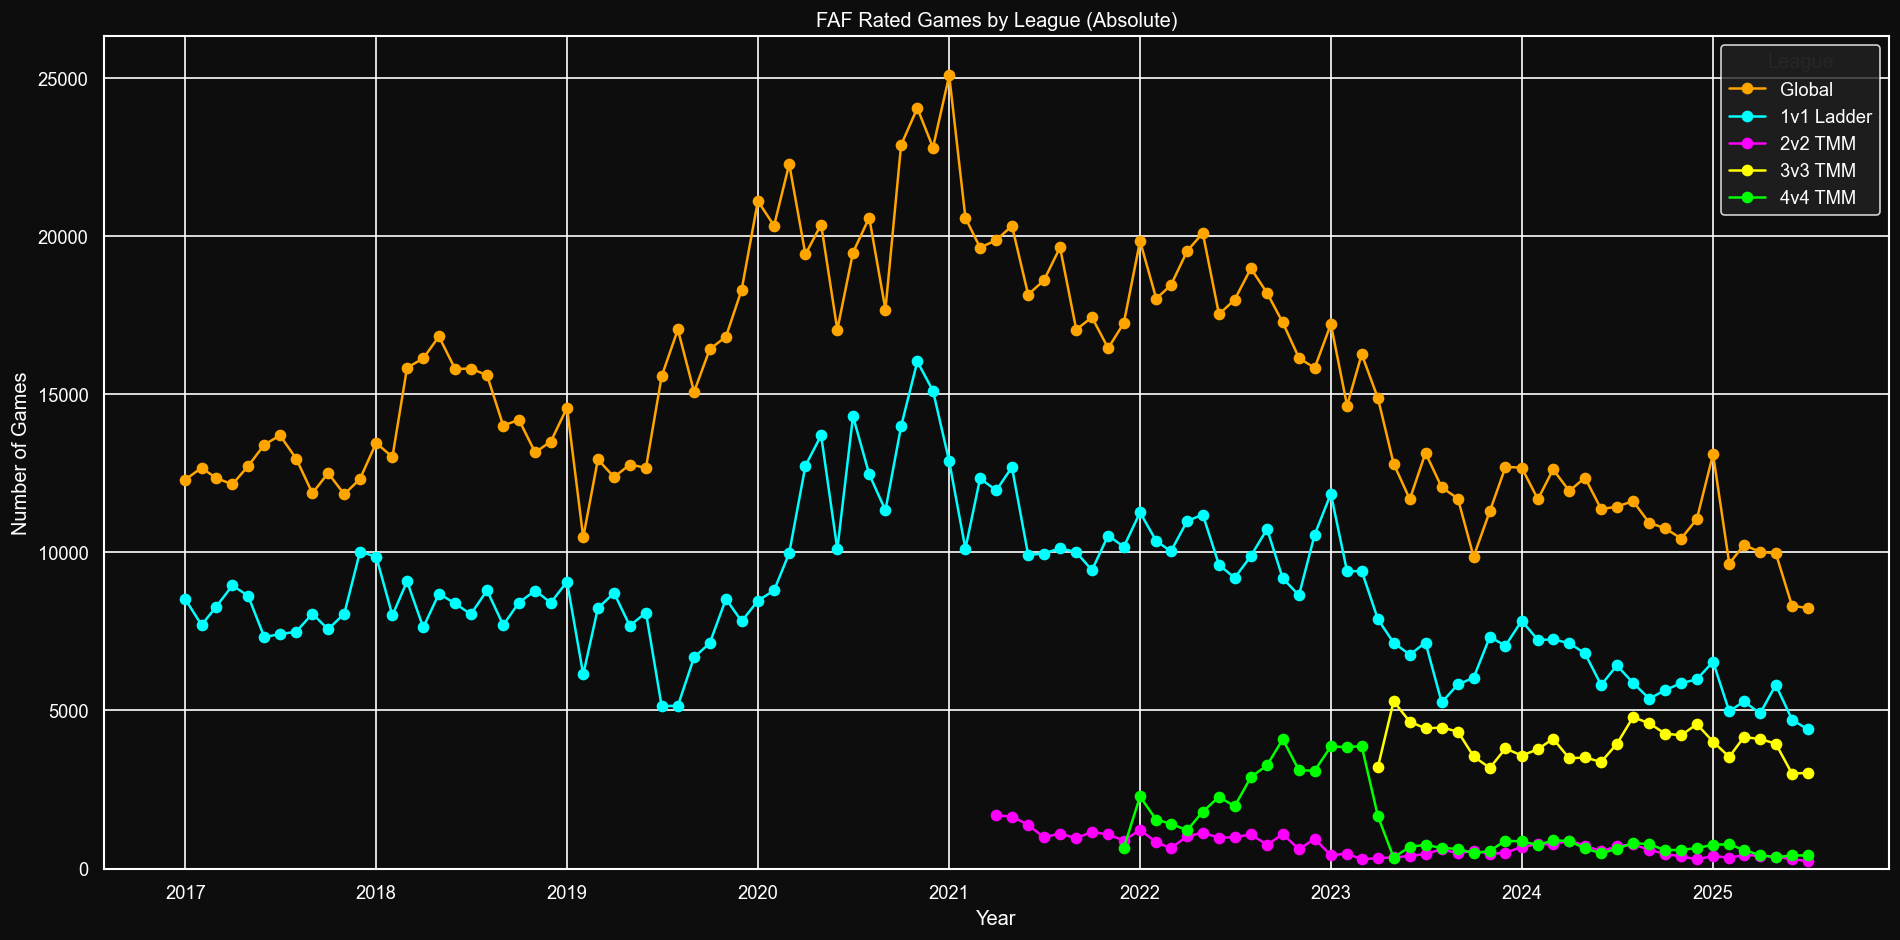
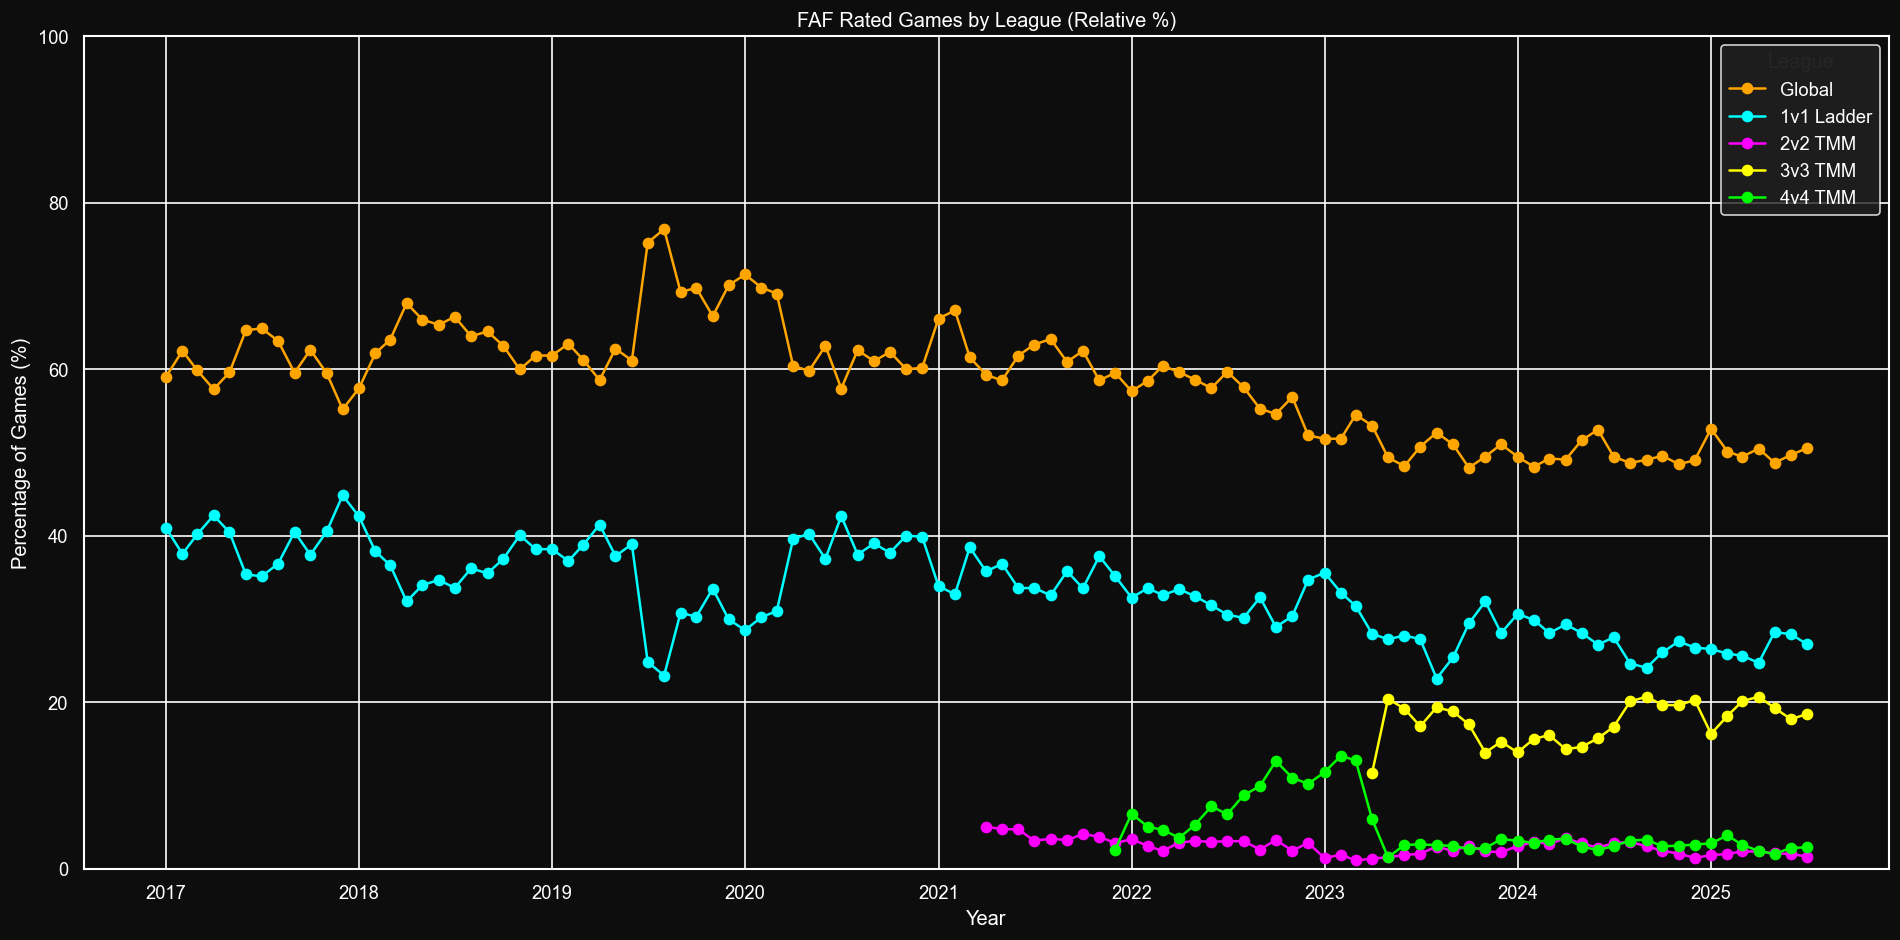
Leagues distribution
For simplicity’s sake I call game type/game mod/rating type a ‘league’. In the past the only game types were global and 1v1 ladder. In 2021-2023 to the matchmaker were added 2v2, 4v4 and last but not least 3v3. 2v2 never got any significant share of games. 4v4, on other hand, was pretty significant - until it got eaten by 3v3. Ultimately 3v3 TMM grabbed some share from global and 1v1.
Number of games
Percentage share
Global
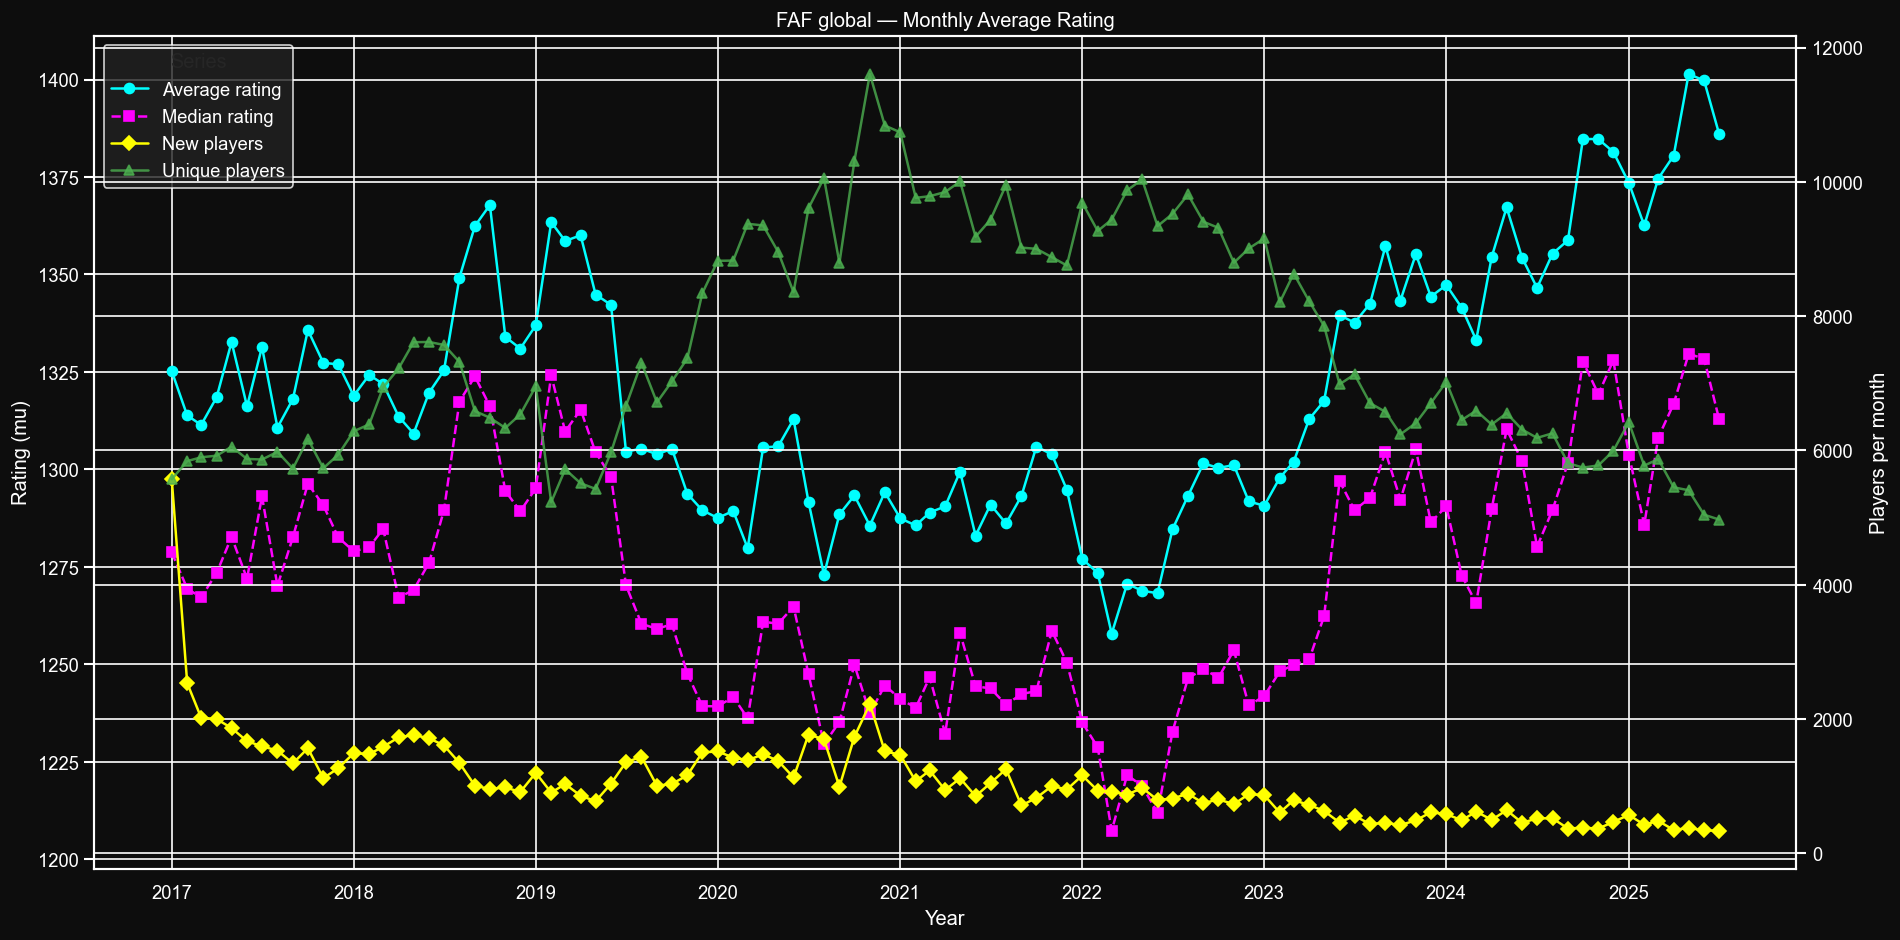
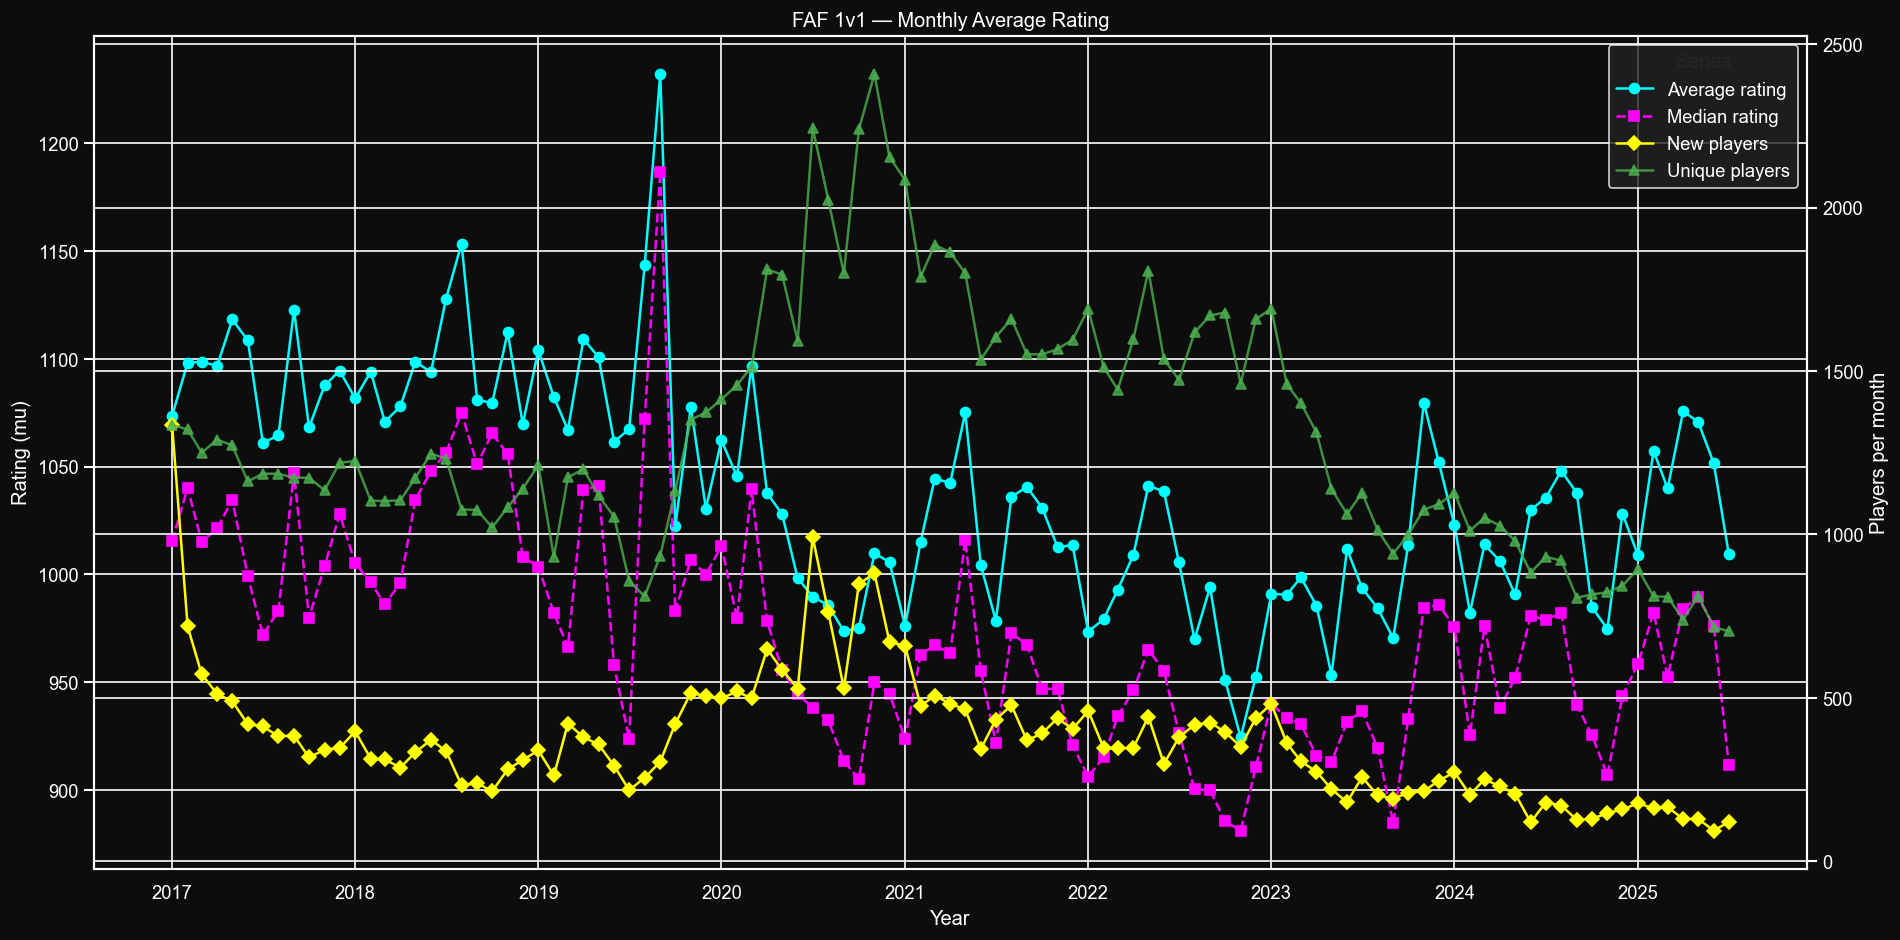
Note than median and average are not the same. Median means that 50% of players are below and another 50% of games are above median. Top players drive the average significantly higher than median.
Average/median rating and new/unique players
Arrival of new players drives both average and median games rating down. The lack of new players does the opposite, since skilled players are more likely to remain. There is no other observable factor to rating "inflation" or "deflation".
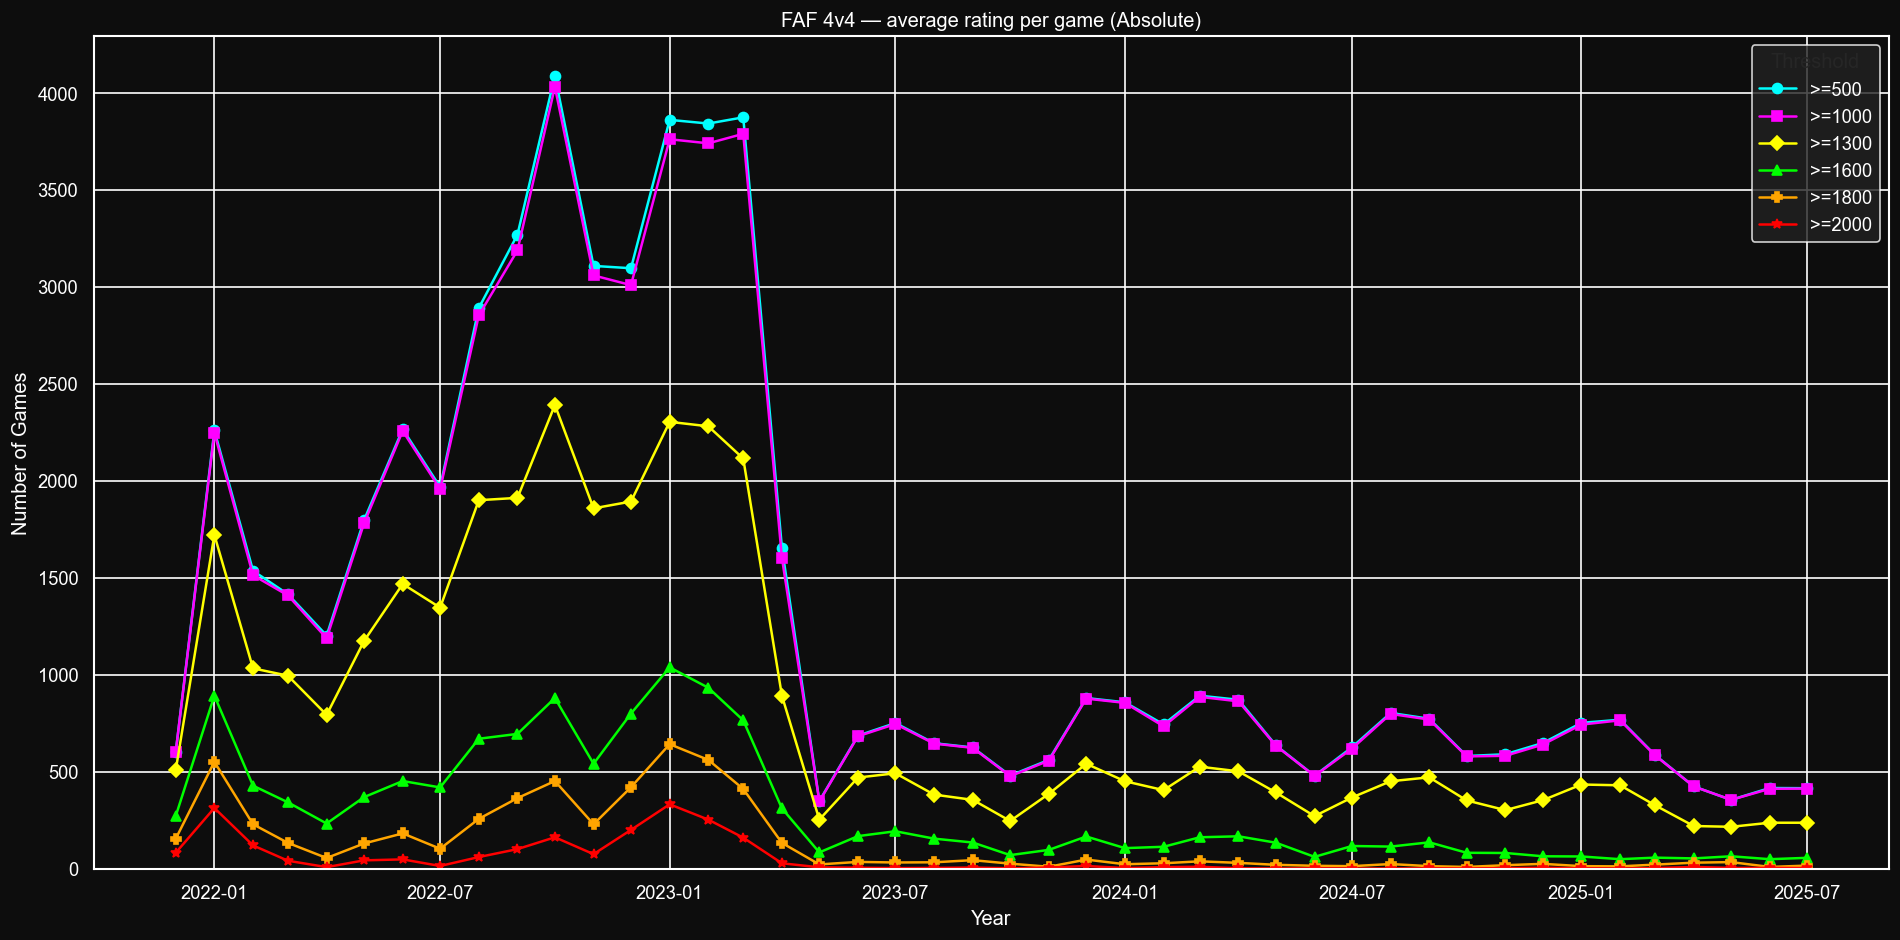
Number of avg rated games
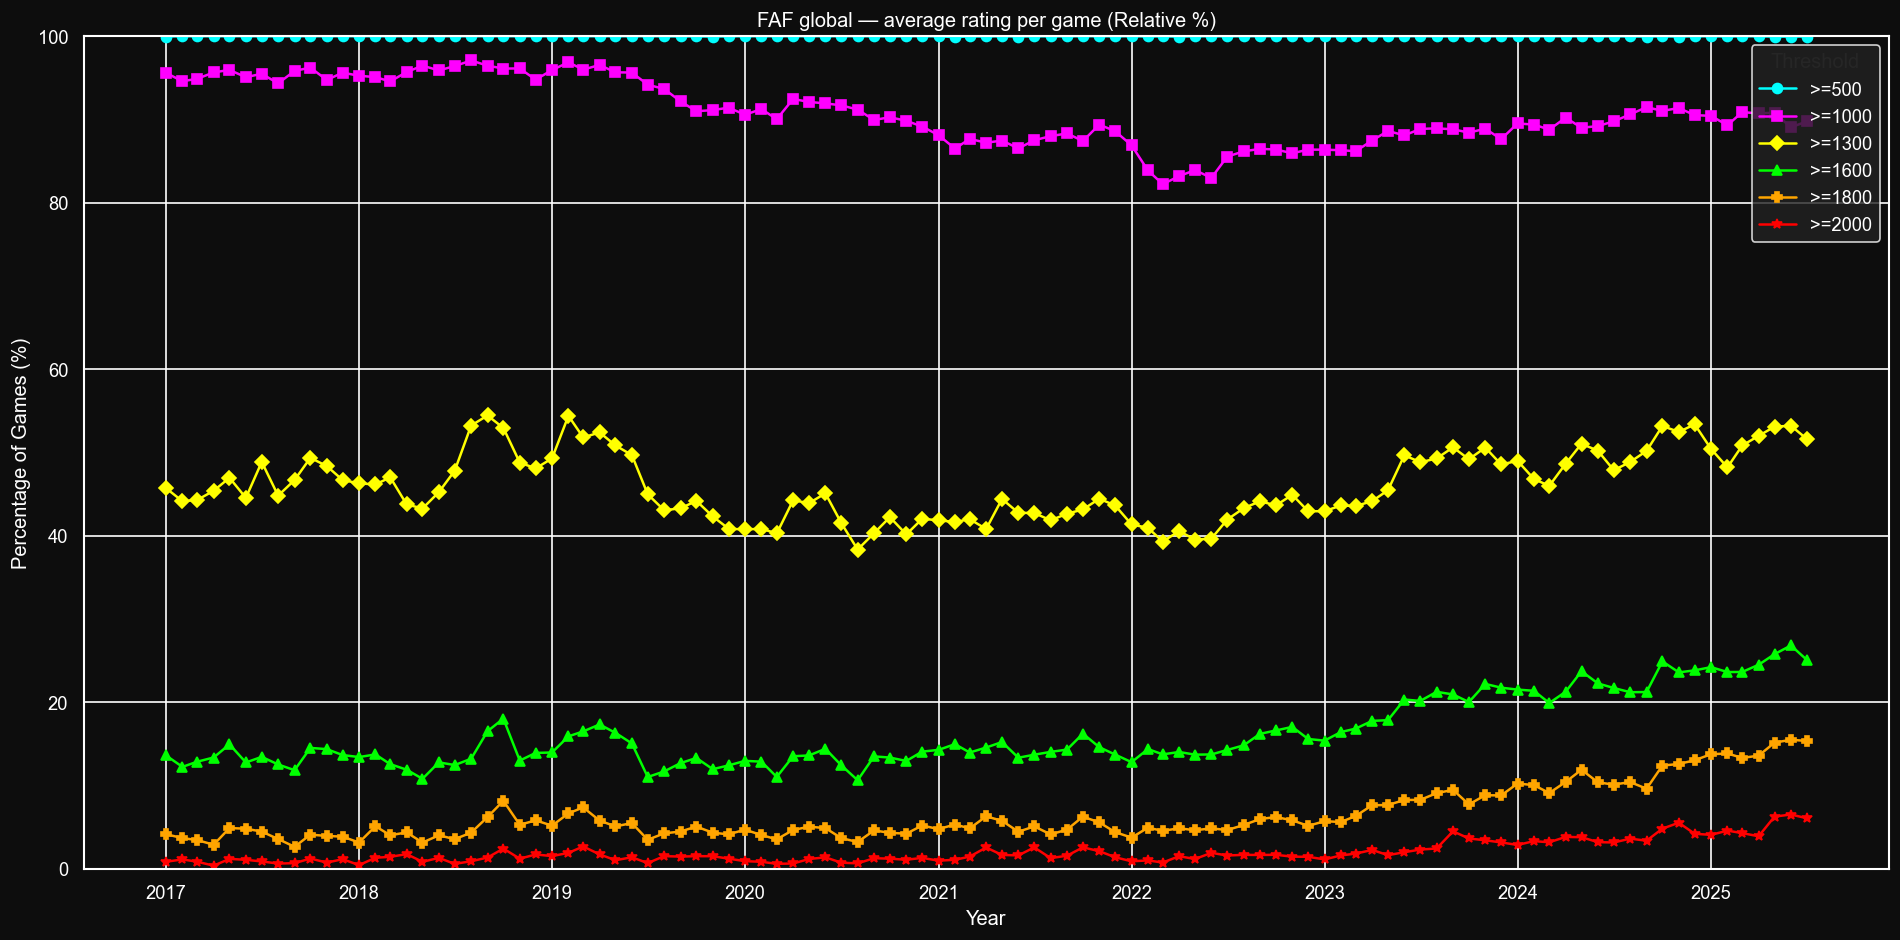
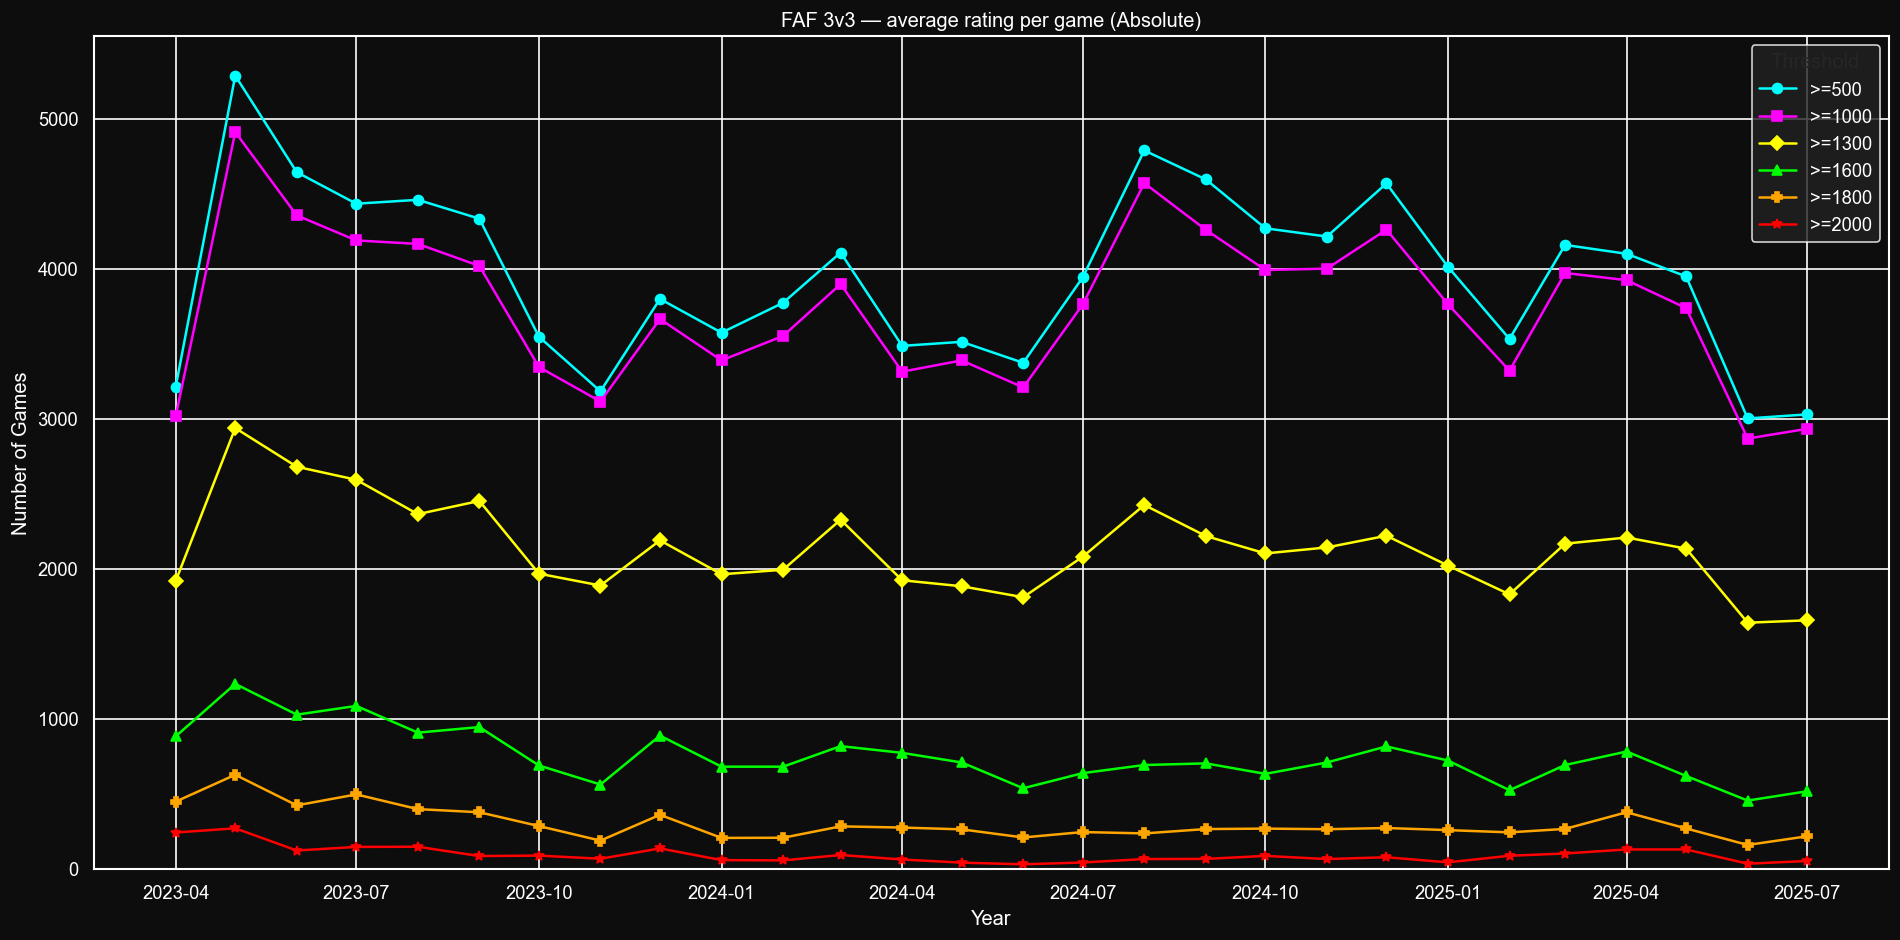
In global almost every game with an average rating higher than 500 is also higher than 1000. In 2017-2020 they were almost perfectly matched. Today they are a bit more spread apart, but still surprisingly close.
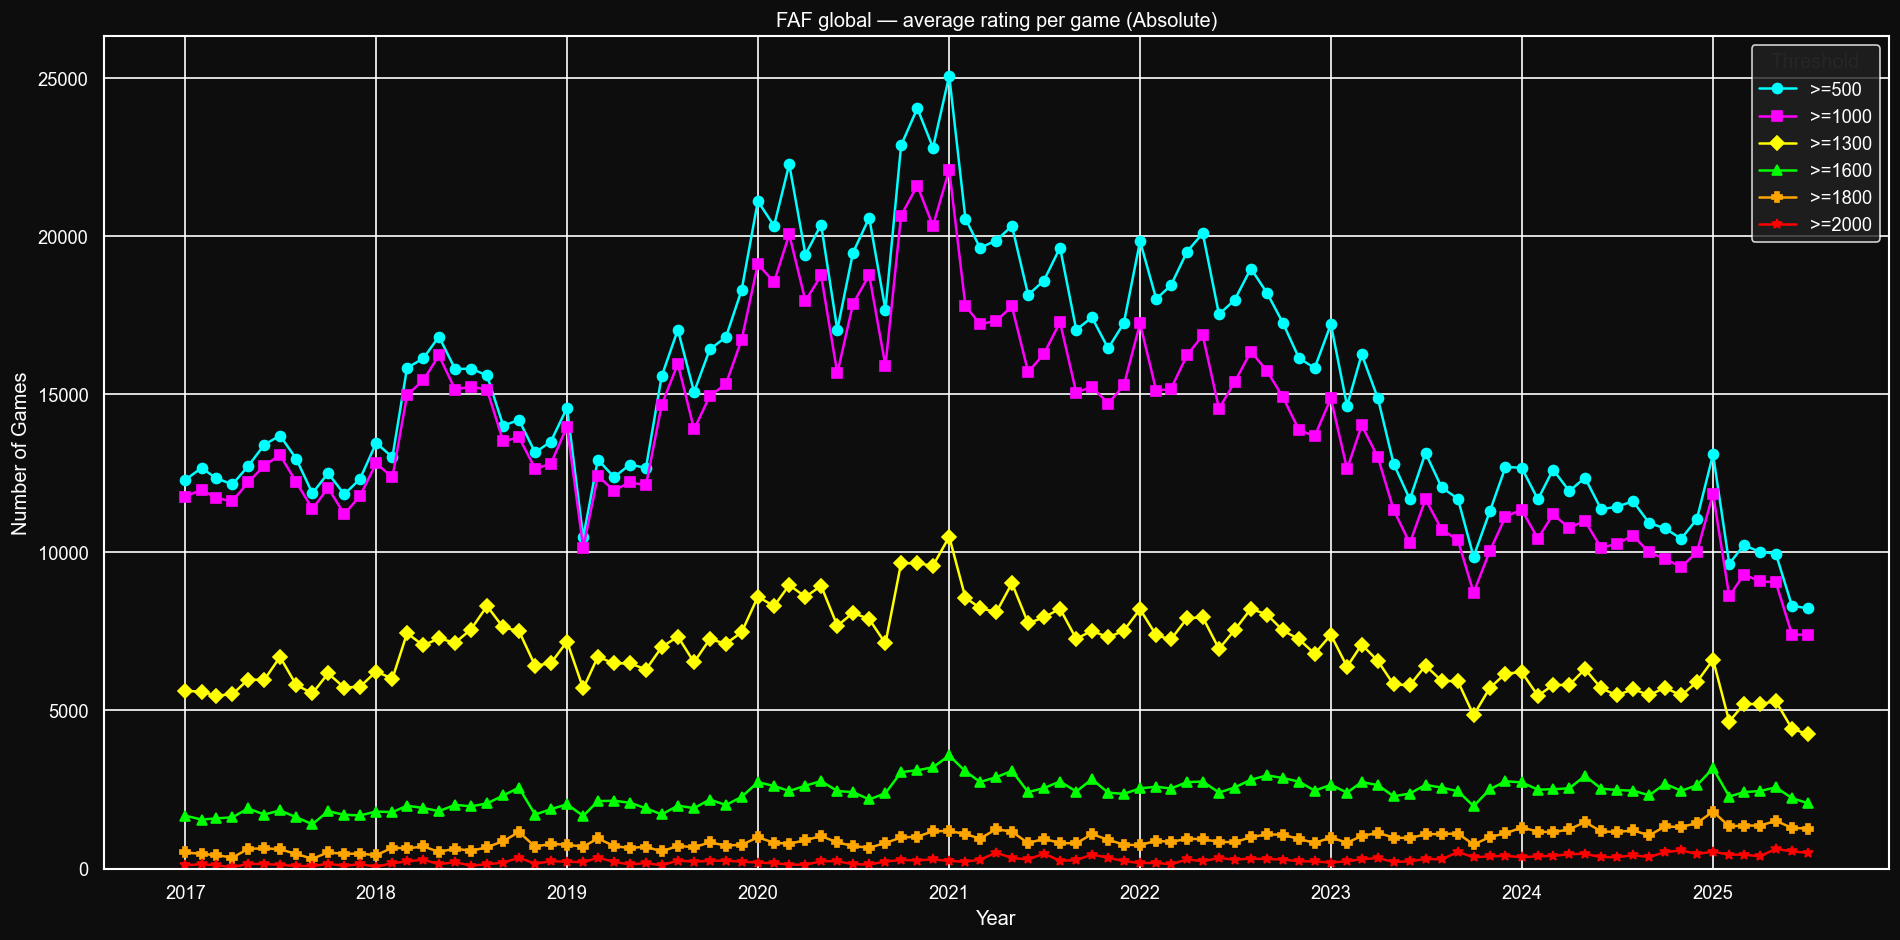
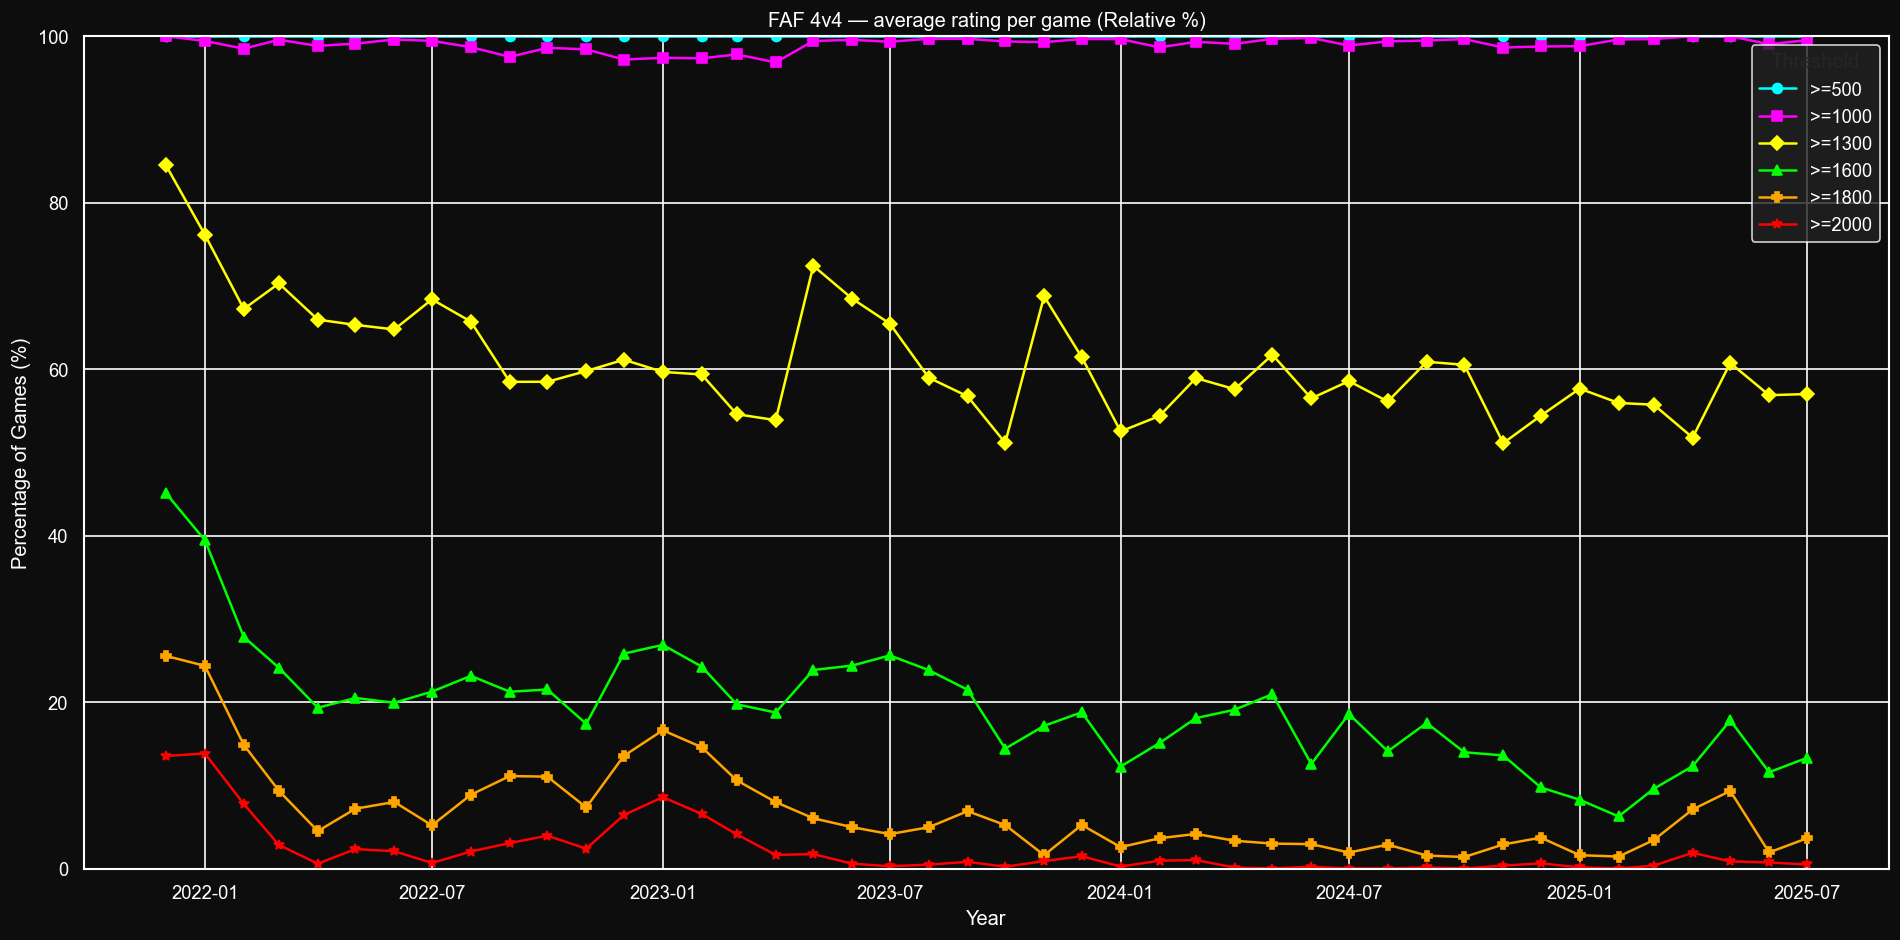
Average games rating, percentage
Ladder
Players and ratings
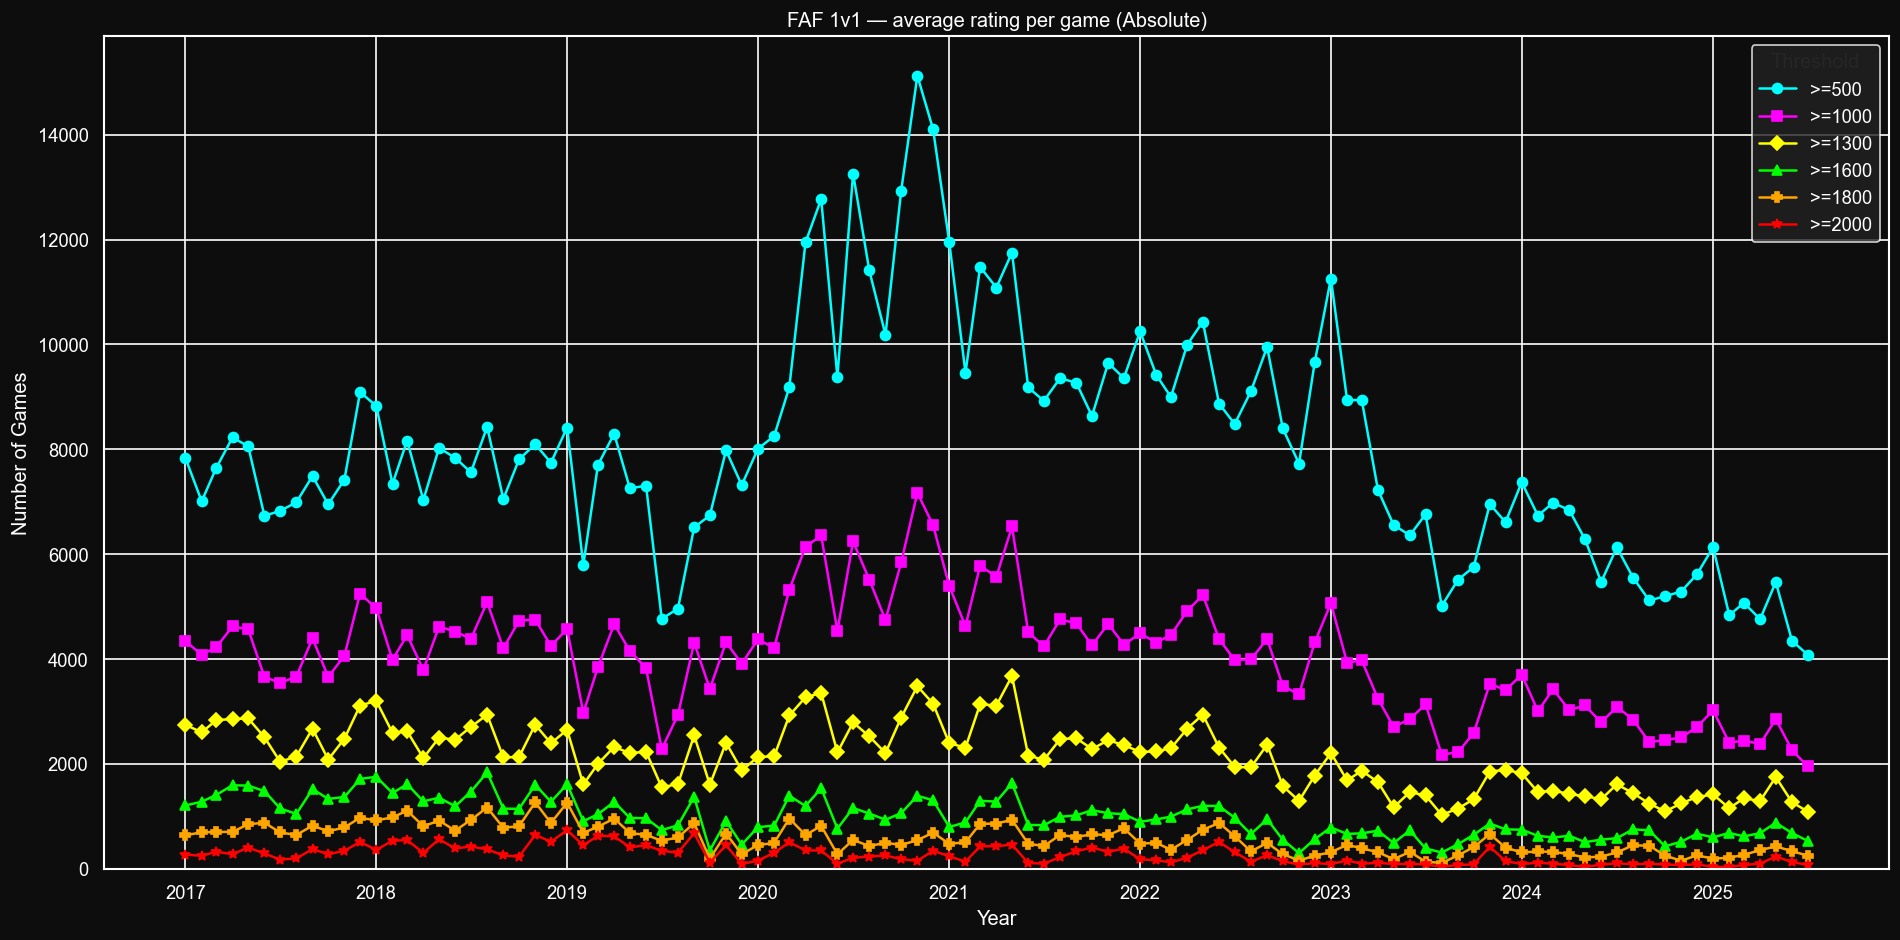
Number of avg rated games
Ladder is the only league with a significant amount of games with average rating less than 500. The share of games with average rating between 500 and 1000 is ladder is also much higher than in global, where 500-1000s players are much more likely to get teamed up with 1500+ in some big lobby. As a consequence, in ladder both median and average are around 300-400 points smaller compared to global.
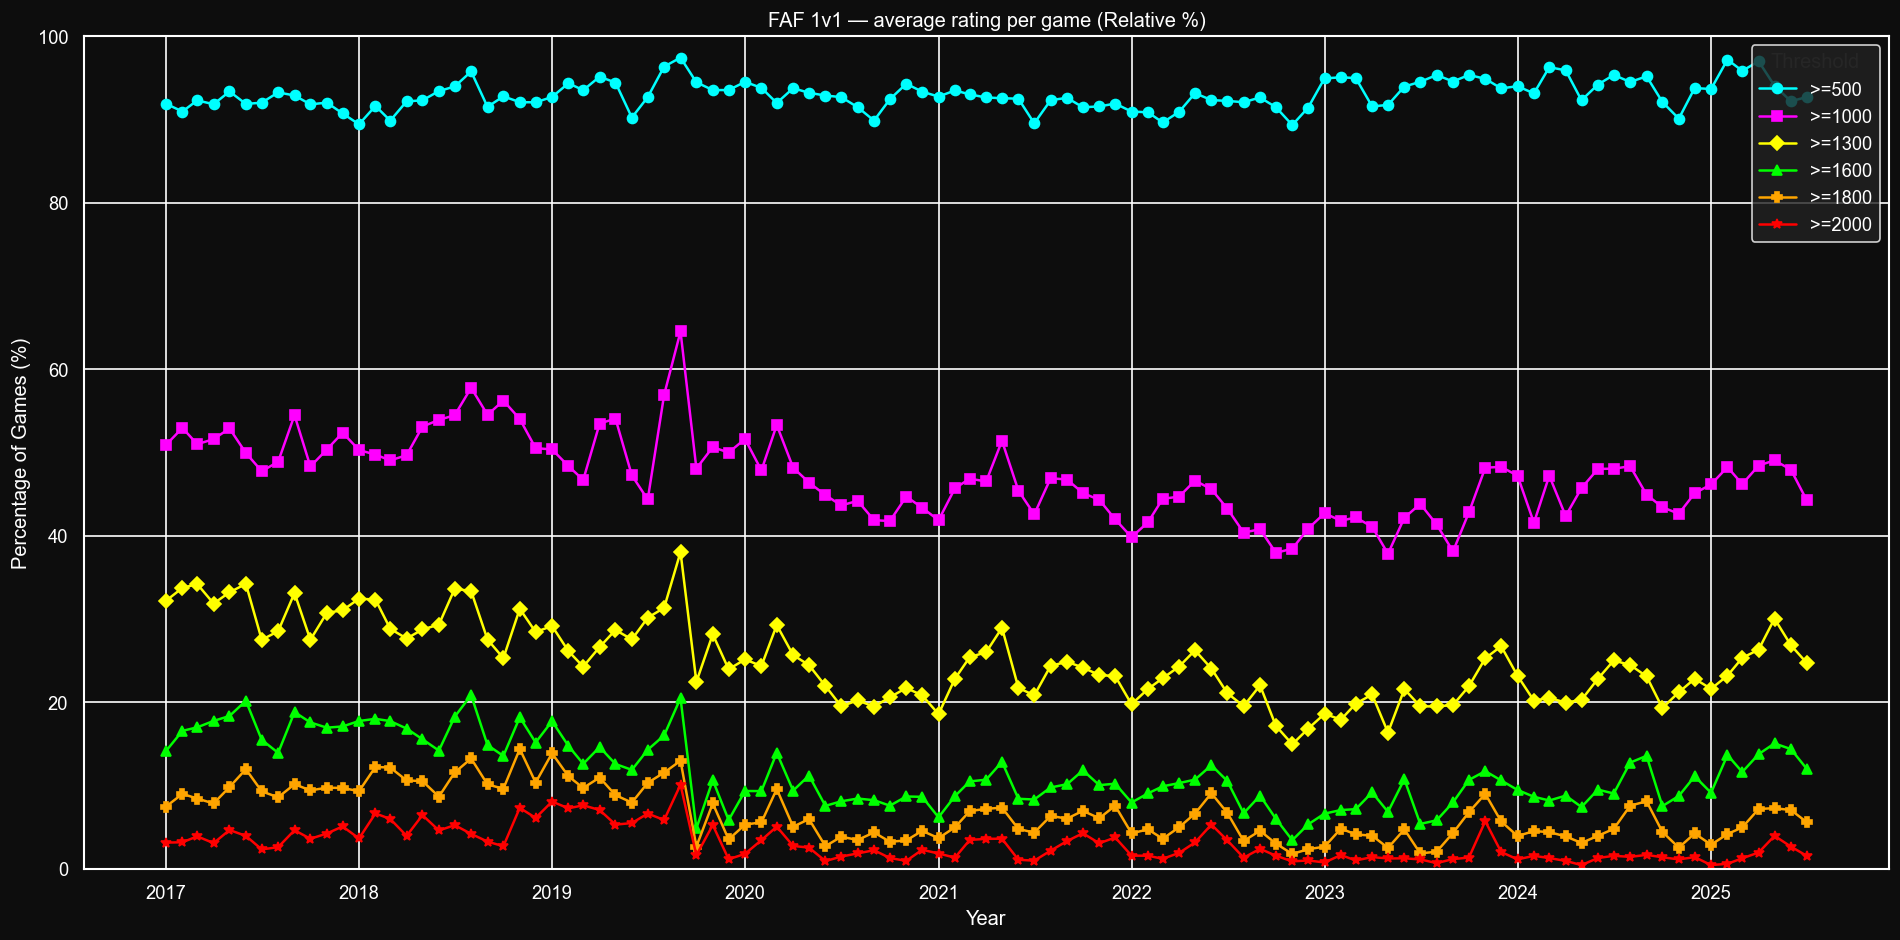
Average games rating, percentage
Top ladder
Amount of ladder games with an average rating above 1800 has peaked at over 1000 games per month at the end of 2018-beginning 2019 and decreased ever since. It did not benefit from the increased player activity during the pandemic.
Number of avg rated games
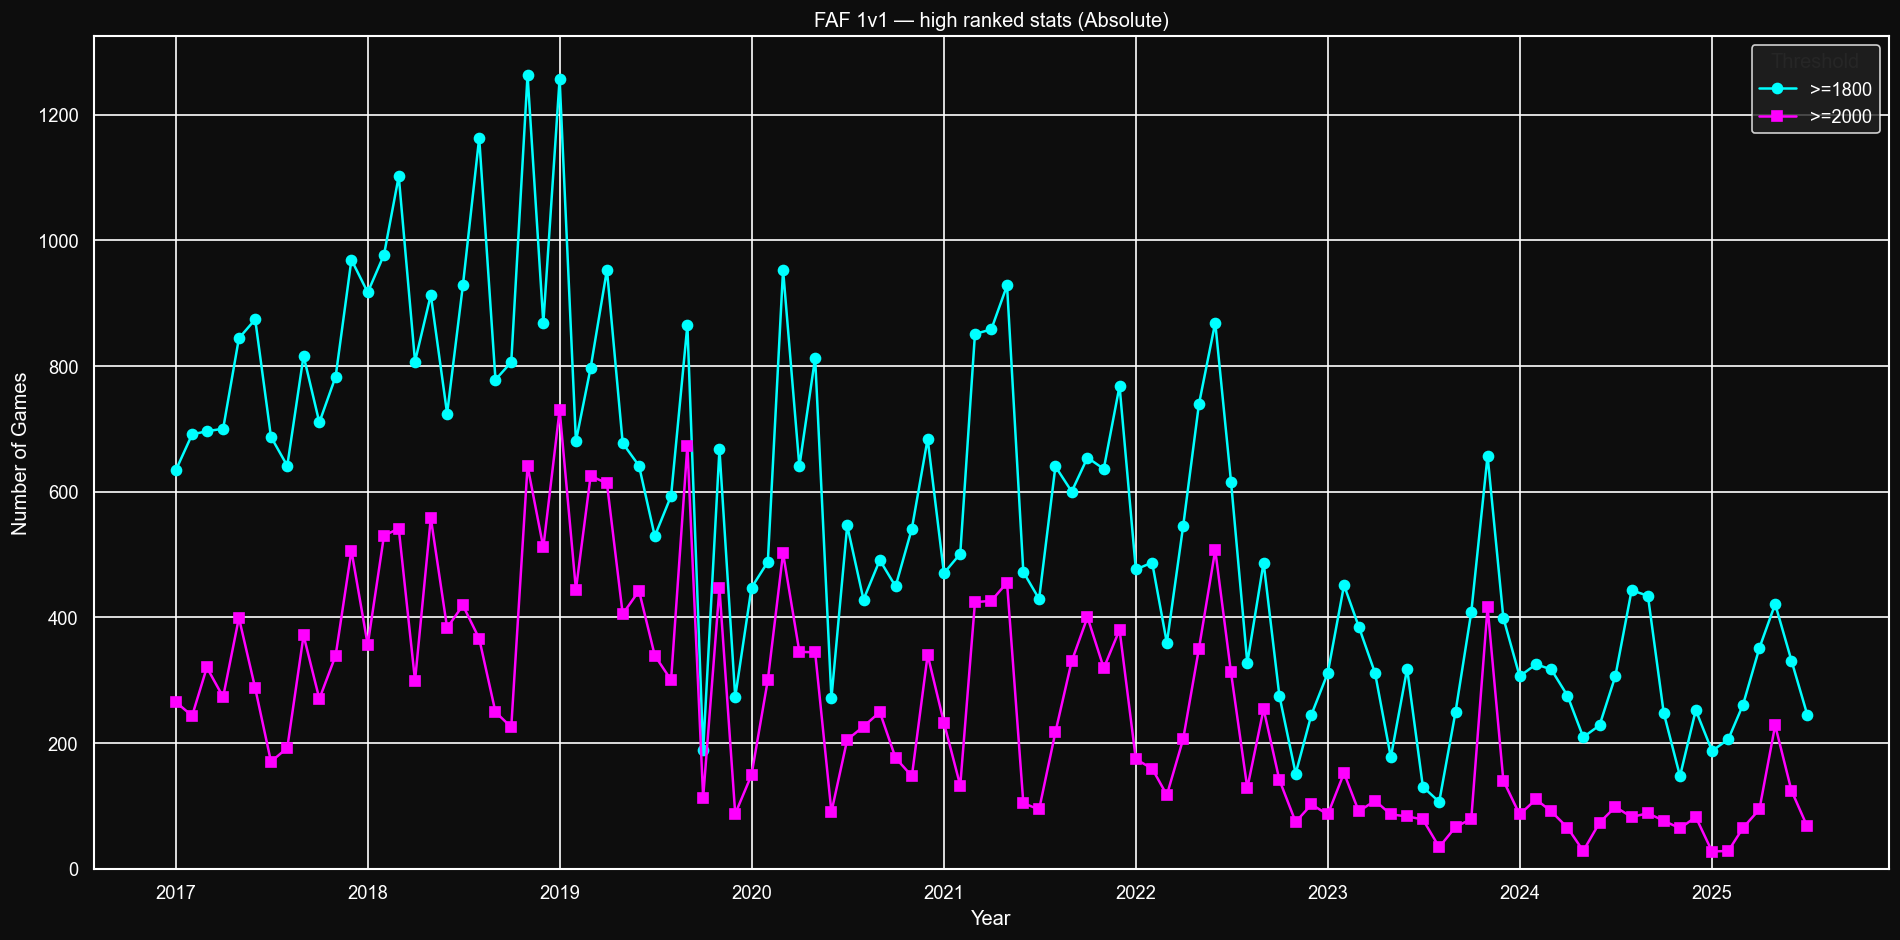
Share of games
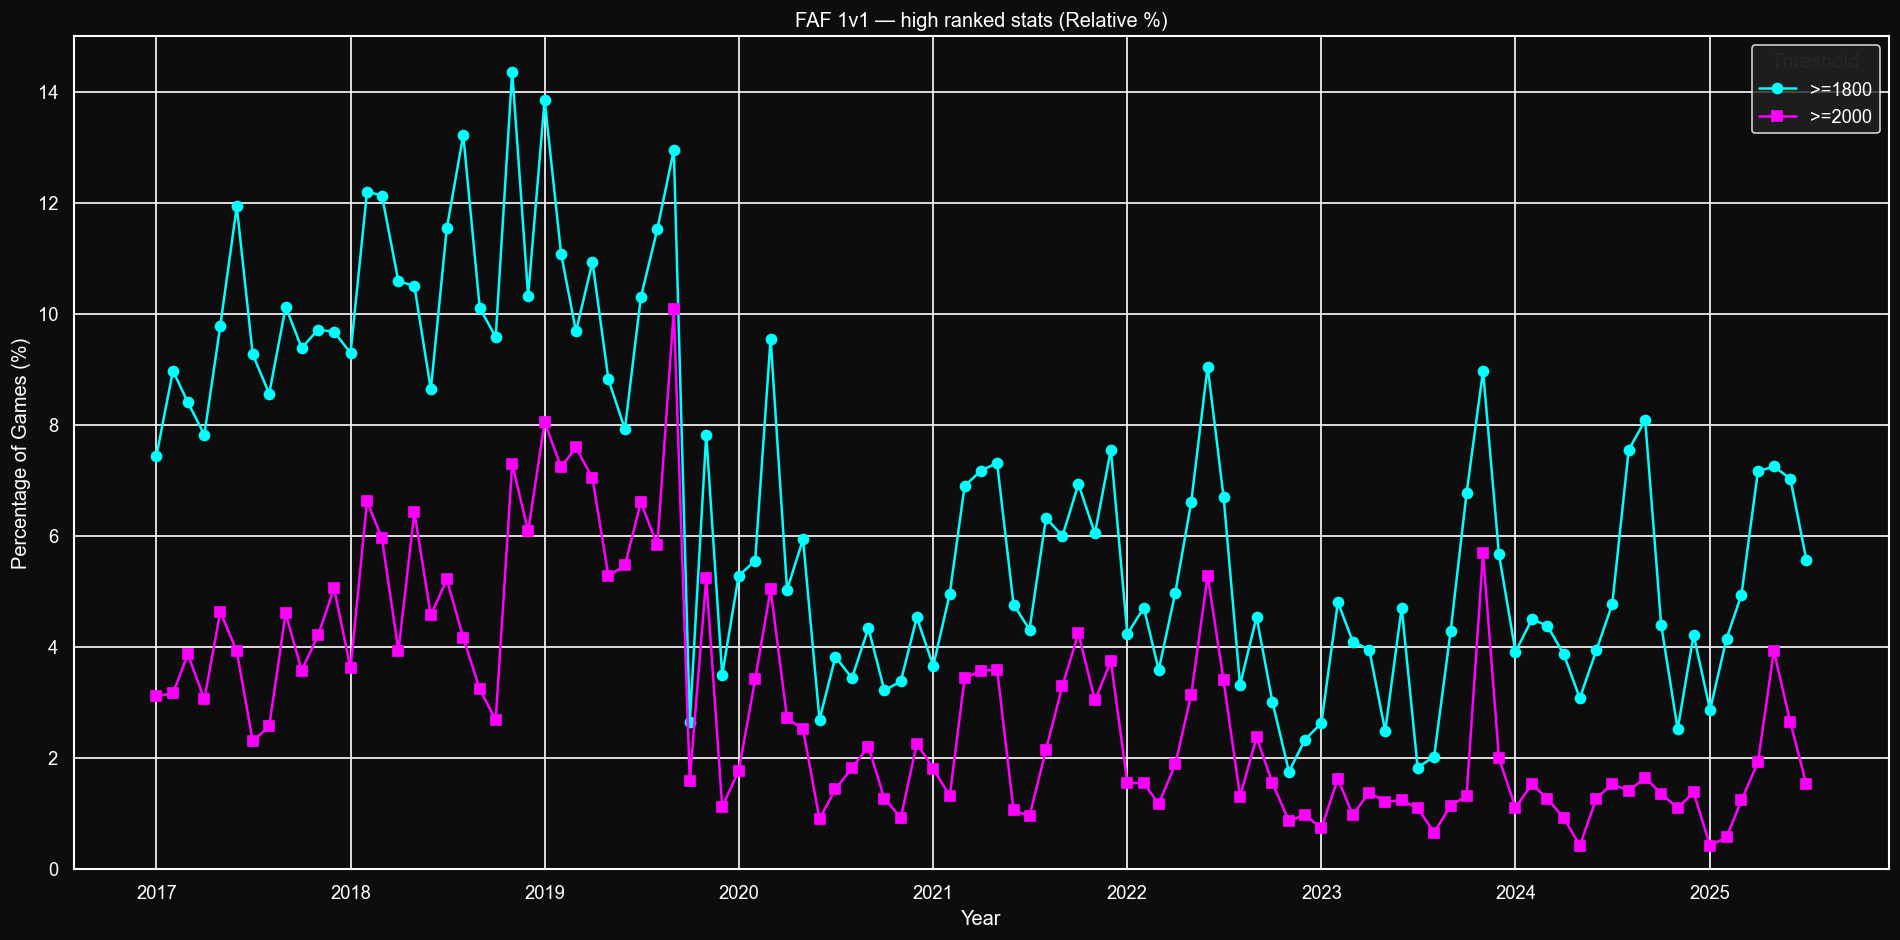
Table
Here only Januaries of every year are compared, not every month or every year. With the overall decrease in games the ratio of >=1800 to >=2000 games increases, as two 2k players are becoming more likely to be matched against sub-2k player during the overall shortage of activity.
Year, month >= 1800 >= 2000 Ratio 2017-01 634 265 2.39 2018-01 917 356 2.58 2019-01 1257 730 1.72 2020-01 447 149 3.00 2021-01 470 232 2.03 2022-01 476 174 2.74 2023-01 311 86 3.62 2024-01 306 86 3.56 2025-01 187 27 6.93 2v2 TMM
Players and ratings
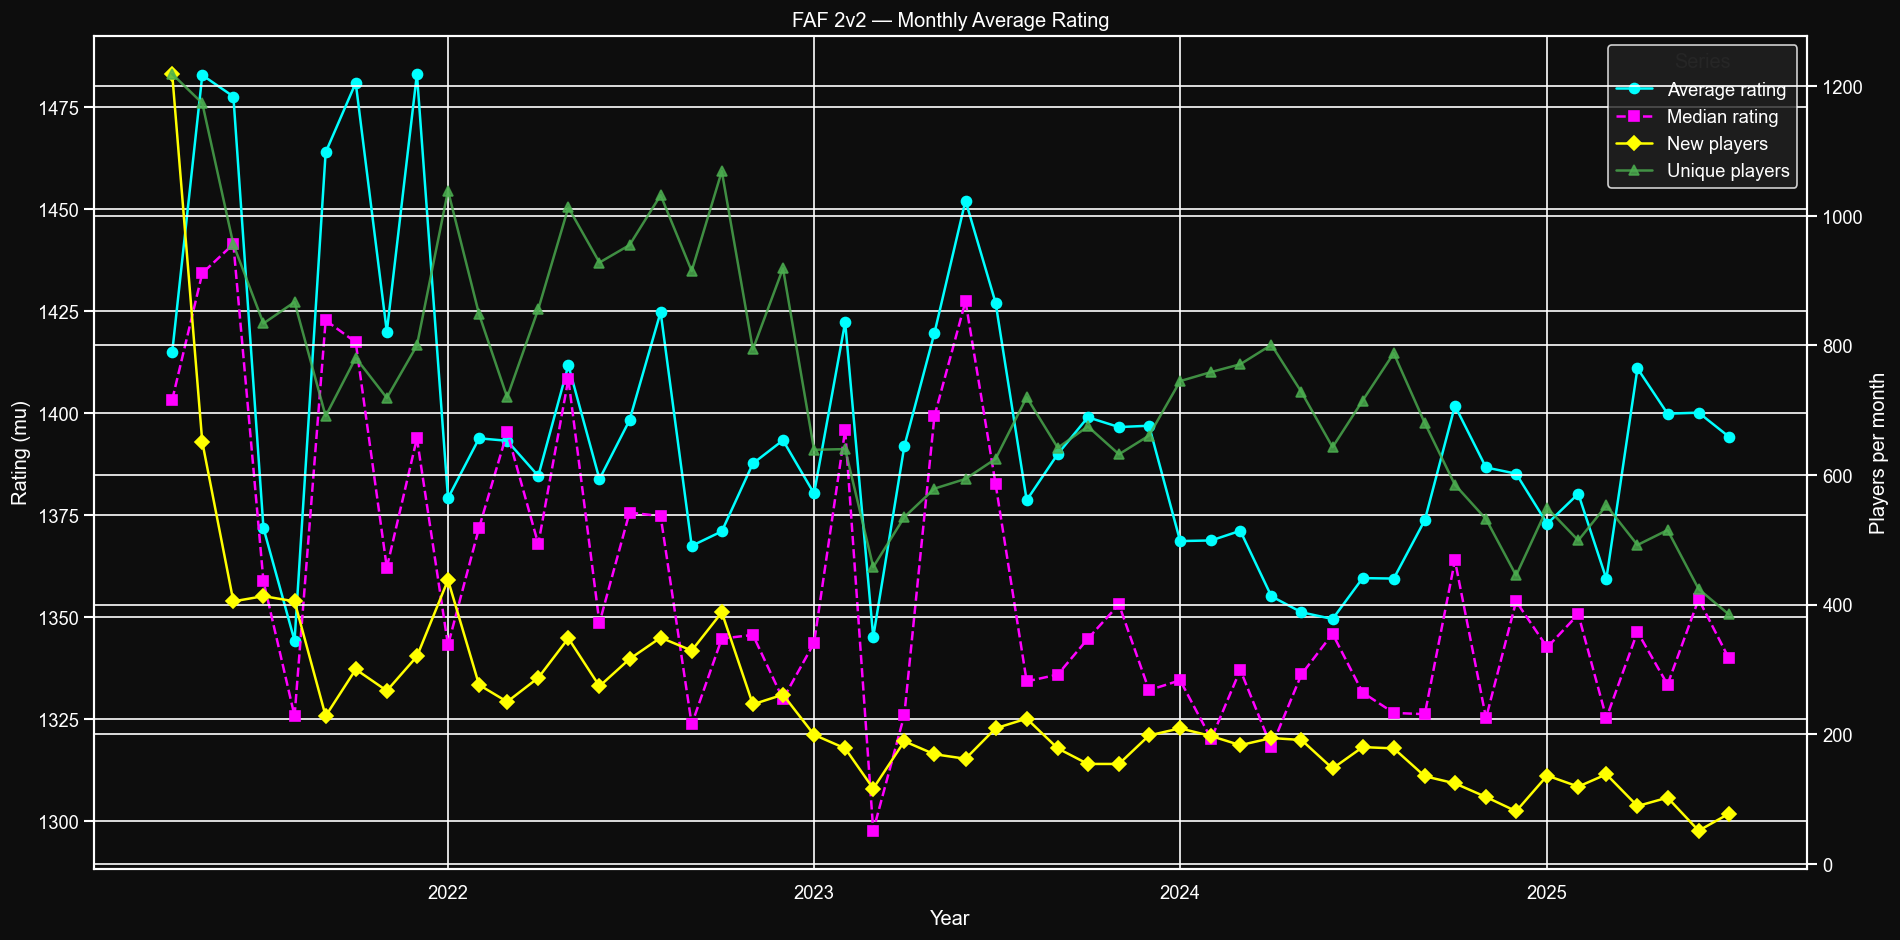
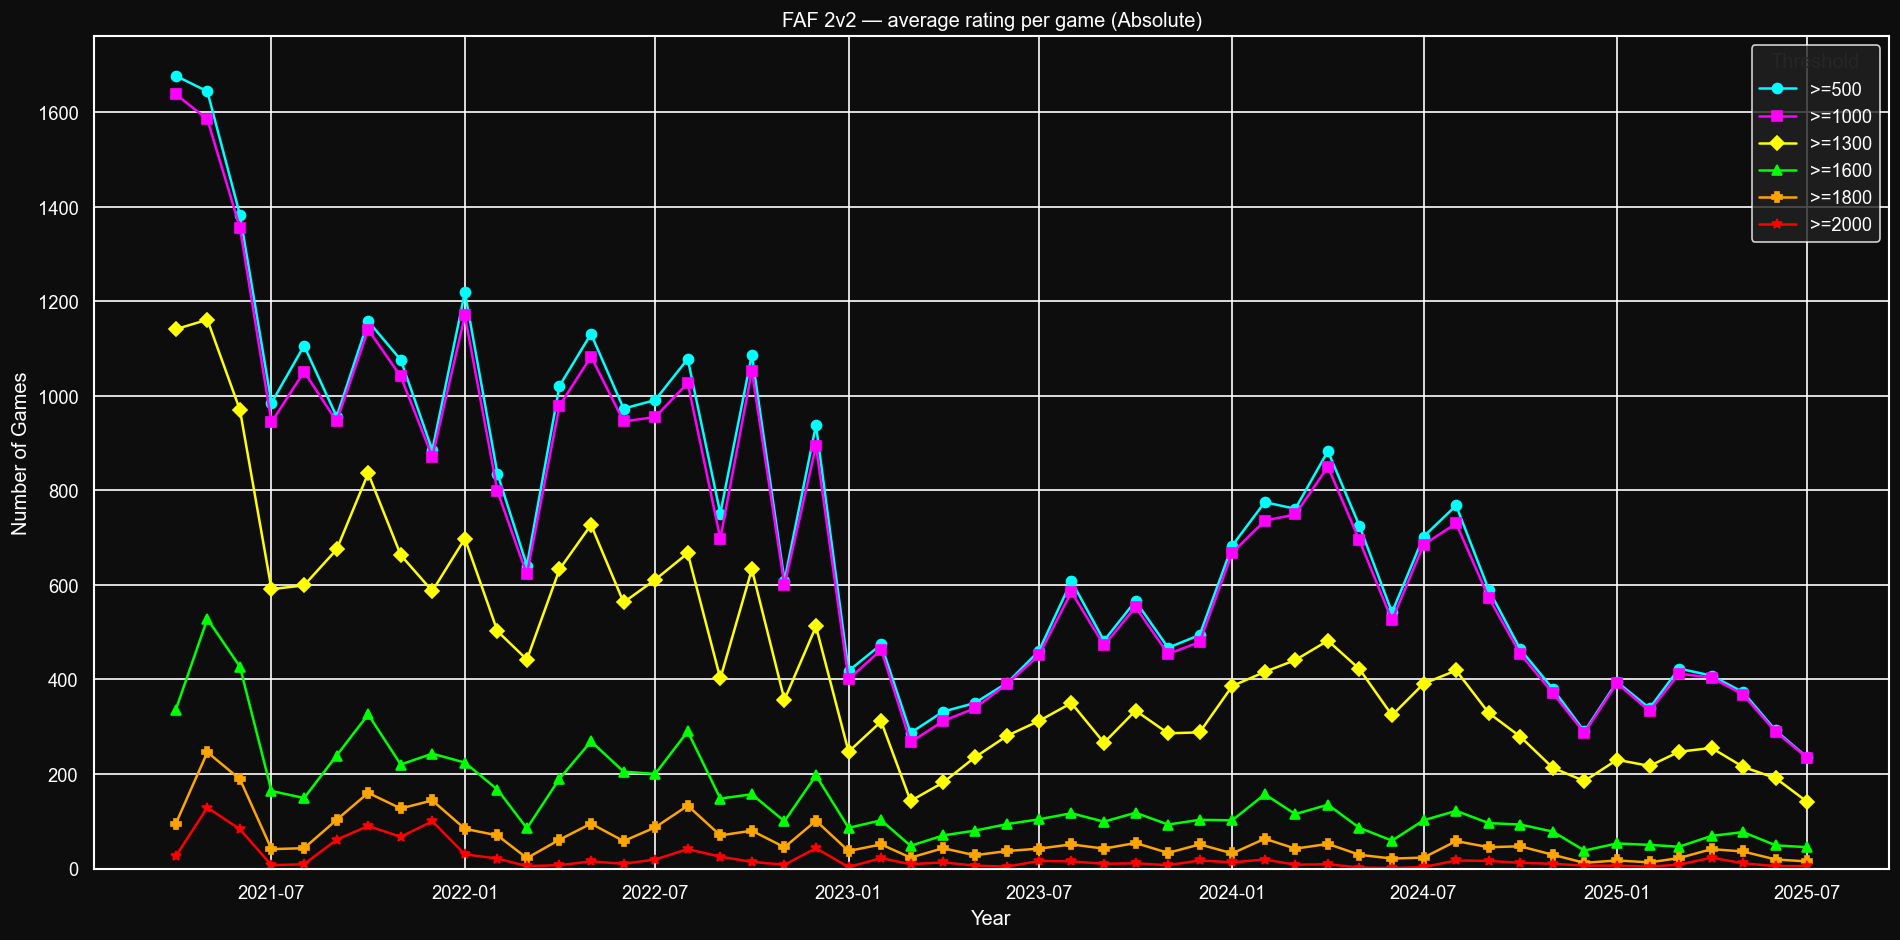
Number of avg rated games
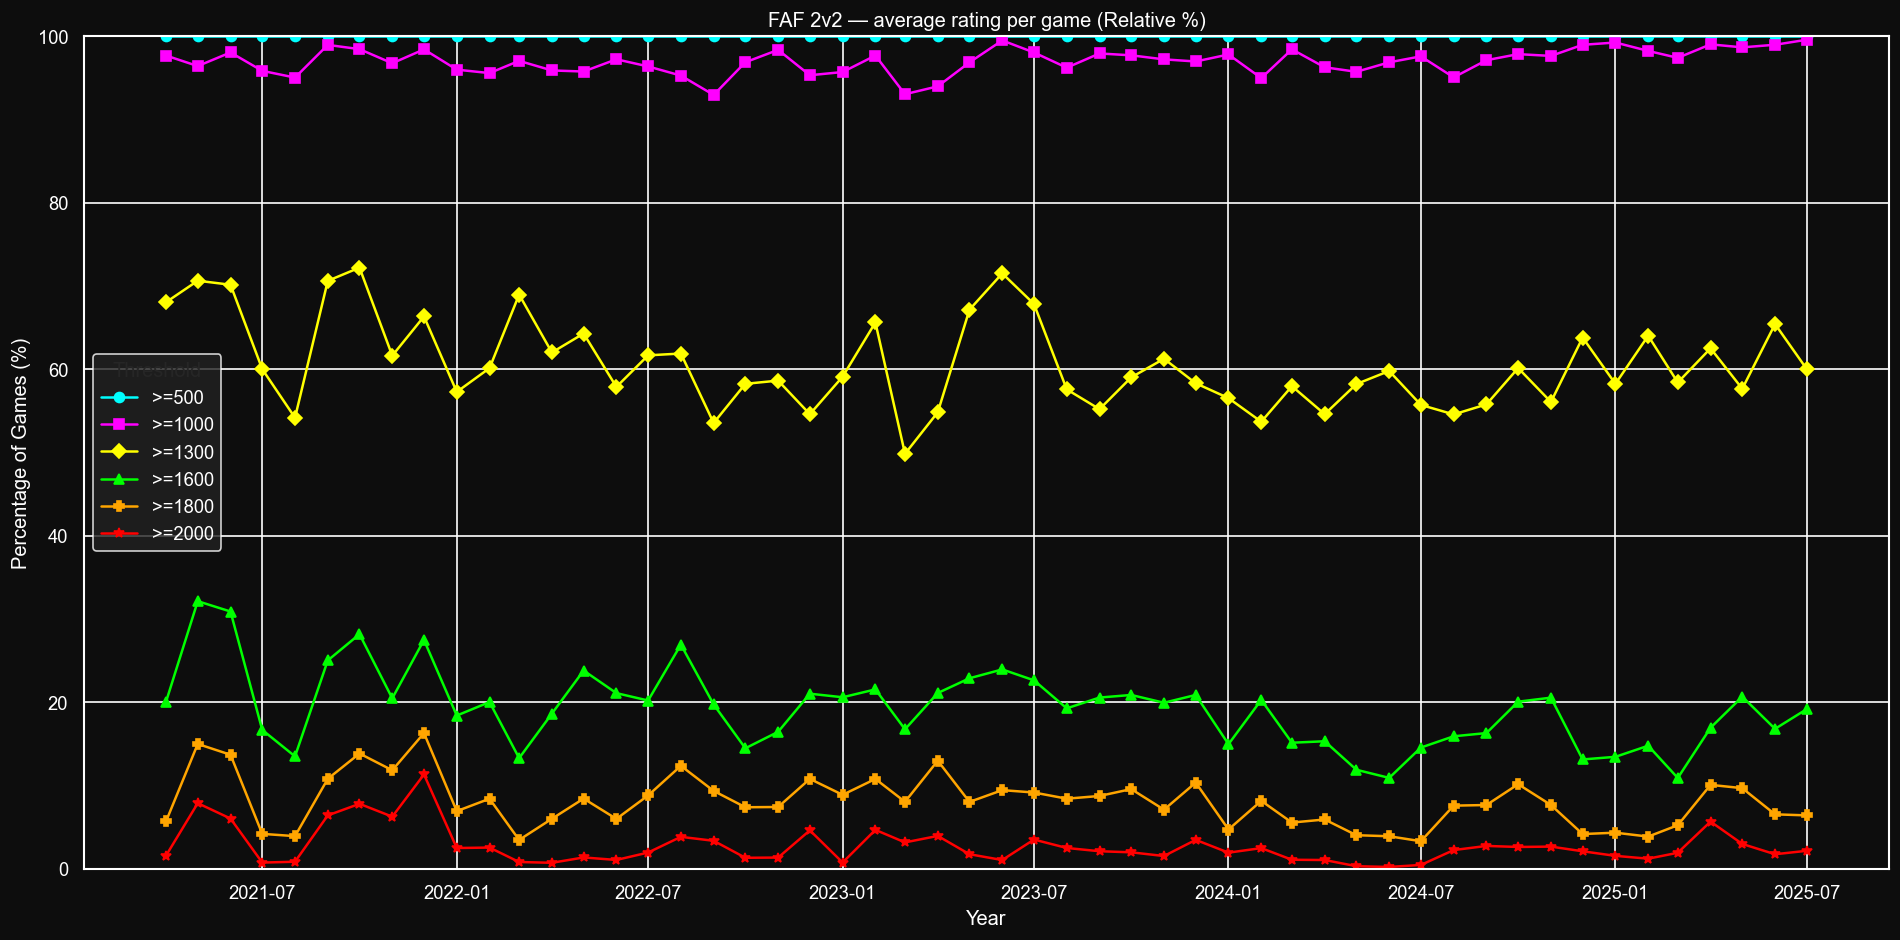
In 2v2 surprisingly share of 500-1000s games is even less than in global. There is also virtually no <500 games. Average and median are only slightly below global levels.
Average games rating, percentage
3v3 TMM
Players and ratings
Number of avg rated games
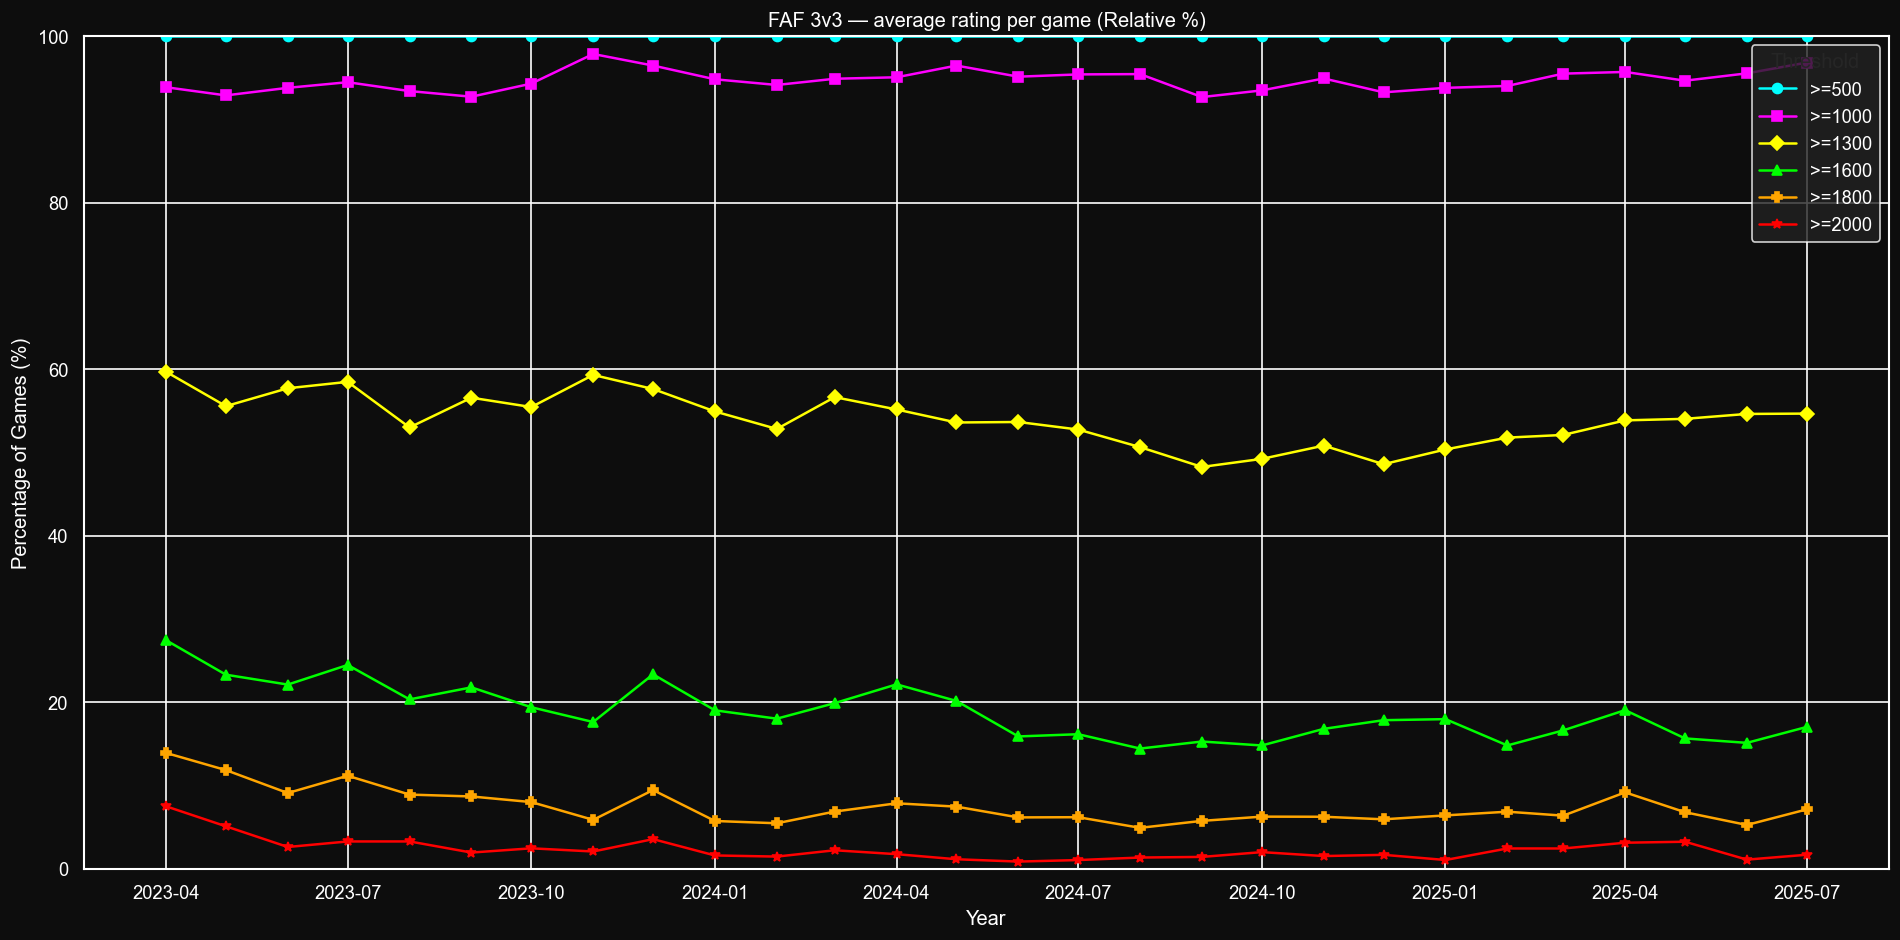
Average games rating, percentage
4v4 TMM
Players and ratings
Number of avg rated games
With introduction of 3v3 the amount of 4v4 games has significantly decreased. Most people queue both for 3v3 and 4v4, and 3v3 inevitably fills faster than 4v4.
Average games rating, percentage
-
Nice, thanks for doing more stats. Glad the code I sent helped.
I think you posted the same graph twice under Leagues distribution.
Arrival of new players drives both average and median rating down. The lack of new players does the opposite, since skilled players are more likely to remain. There is no other observable factor to rating "inflation"/"deflation".
Without a proper regression analysis you cannot really draw this conclusion. Also, how did you calculate rating? From memory your numbers are different than mine. I suspect you might have calculated rating wrong.
The graph for 'Average games rating, percentage' would make more sense as a stacked bar chart of a stacked area chart. Current the line for >=1000 is this high because it includes ALL games above average 1000 rating. That's not very informative.
-
@IndexLibrorum said in FAF Statistics Megathread 2 Statistics Boogaloo:
I think you posted the same graph twice under Leagues distribution.
Fixed, thank you.
Also, how did you calculate rating? From memory your numbers are different than mine. I suspect you might have calculated rating wrong.
Sum of players' ratings at the beginning of the game divided by the amount of players in the game. This is games' median/average, not players' median/average. If Player1 has 10X more games than Player2, it will have 10X more impact on games' median/average. So it pretty much should give a different number.
The graph for 'Average games rating, percentage' would make more sense as a stacked bar chart of a stacked area chart.
I've reused the template I already had as it's still readable. But ngl that's indeed a better idea, I will take a look at it.
-
@Sainse Awesome! Thanks!
-
For brand-new players or “noobie noobs,” FAF can be brutal. Maybe keep the kids in a sandbox until they’ve put in some playtime or shown basic skills, before releasing them to the blood-thirsty high-rated players who like to pick off noobs or punish them for taking the “wrong pile of rocks.” (Referring to the DG map with its unwritten house rules.) The learning curve is just too steep for new players to jump straight onto the main server—most don’t have any fun and leave.
The “foe” system also needs work. Foeing should be temporary—maybe 1 day, 5 days, whatever—because players forget who they foed. Suddenly they can’t host a game because others can’t see their lobby. Permanent foes just shrink the active player base. A timed expiration would let wounds heal without permanently cutting connections.
International play is another huge issue. Right now, Russian, AU, and North American players can rarely get a smooth game together. Two out of three games restart within a few minutes of launch. That kills momentum and frustrates everyone. Think about it—FAF is supposed to be a global platform, but cross-region games barely function. That cuts the player pool in half (or thirds), making it harder to get games started at all. Back in 1995, Gamespy with C&C hosted thousands of players and every game launched. FAF should be able to do the same. If that means scrapping the current setup and starting over, then do it.
So:
Give new players a sandbox before throwing them into the general population.
Put a timer on “foe” lists so the community doesn’t shrink.
Fix international game play, even if that means rebuilding the infrastructure.
Finally, maybe turn on a light-touch abusive language filter. Just enough to remind players not to cross the line during games—but not so strict that “bad bunny” gets flagged as a racial slur. lol
-
@TexasDeath Not sure why this is in this thread about statistics tbf. Might be better to put this in its own thread? I can move it for you, if you'd like.
-
This post is deleted! -
 I IndexLibrorum referenced this topic on
-
As requested in the discord, an overview of the highest and lowest ratings recorded. Ratings shown are calculated display rating (mean - 3x deviation).
Some rating manipulation has been used to reach the highest ratings (specifically for John_Doe, though lilSidlil did something similar as far as I know). The lowest ratings might be caused due to some bugs with the rating code.
For these reasons, the data is only somewhat useful, but it's kind of interesting so I've put it here for safekeeping.
Highest:
Username Calculated Rating Score Time (UTC) Game ID John_Doe 3685.206 2024-04-05 16:43:21 22215921 lilSidlil 3405.606 2022-11-27 20:46:14 18616894 Suzuji 3056.911 2019-06-24 19:39:30 9833239 derMarc117 3035.329 2012-04-08 01:40:24 54992 TheWeakie 2898.142 2025-09-21 22:00:12 25636874 Tagada 2775.317 2024-12-25 21:18:21 23926136 galacticfear 2770.694 2015-03-23 20:02:56 3240060 Nomander 2714.813 2025-10-25 23:24:32 25819059 Blodir 2653.693 2023-07-07 20:20:12 20327385 Terarii 2652.204 2025-10-24 19:08:43 25810813 Lowest:
Username Calculated Rating Score Time (UTC) Game ID RedDevil -1936.952 2016-02-13 10:58:05 4428632 Valdez -1630.885 2016-02-16 20:02:13 4443231 QualityDamage -1582.118 2016-02-21 02:43:40 4459290 ViolentNoob -1580.698 2016-02-22 16:52:56 4465062 MaxKofman -1526.452 2012-11-23 18:23:24 444994 HodenGips -1410.853 2016-02-17 13:00:10 4445214 Mikepara -1388.161 2016-02-20 03:17:30 4454587 Vunt -1356.464 2016-02-22 17:25:16 4465378 El_Ombligo -1352.501 2012-04-03 03:09:10 47479 Sweaty -1338.874 2016-02-29 21:54:50 4492828 "Design is an iterative process. The required number of iterations is one more than the number you have currently done. This is true at any point in time."
See all my projects:

-
Interesting. Is there some context around this?
-
There were major server changes in February 2016 which led to rating bugs so that's why you see almost all the lowest ratings being recorded then.
-
@IndexLibrorum Hey man, that's pretty interesting. I've just come across this post when looking up my old gamer tag.
")
Not sure if I can help you with that in any way or offer some input that might help. It has been about 13 years since I've low-key religiously played FA.
I recall that back in the day I was very fond of playing those smaller 5x5 km maps a lot, because I really enjoyed that T1 tank spam and ACU overcharge micromanagement.
Perhaps I was doing pretty good with that.Are those ratings ranked or custom, does that even differ?
Have a good one guys. Maybe I'll have to turn on FA once again.
-
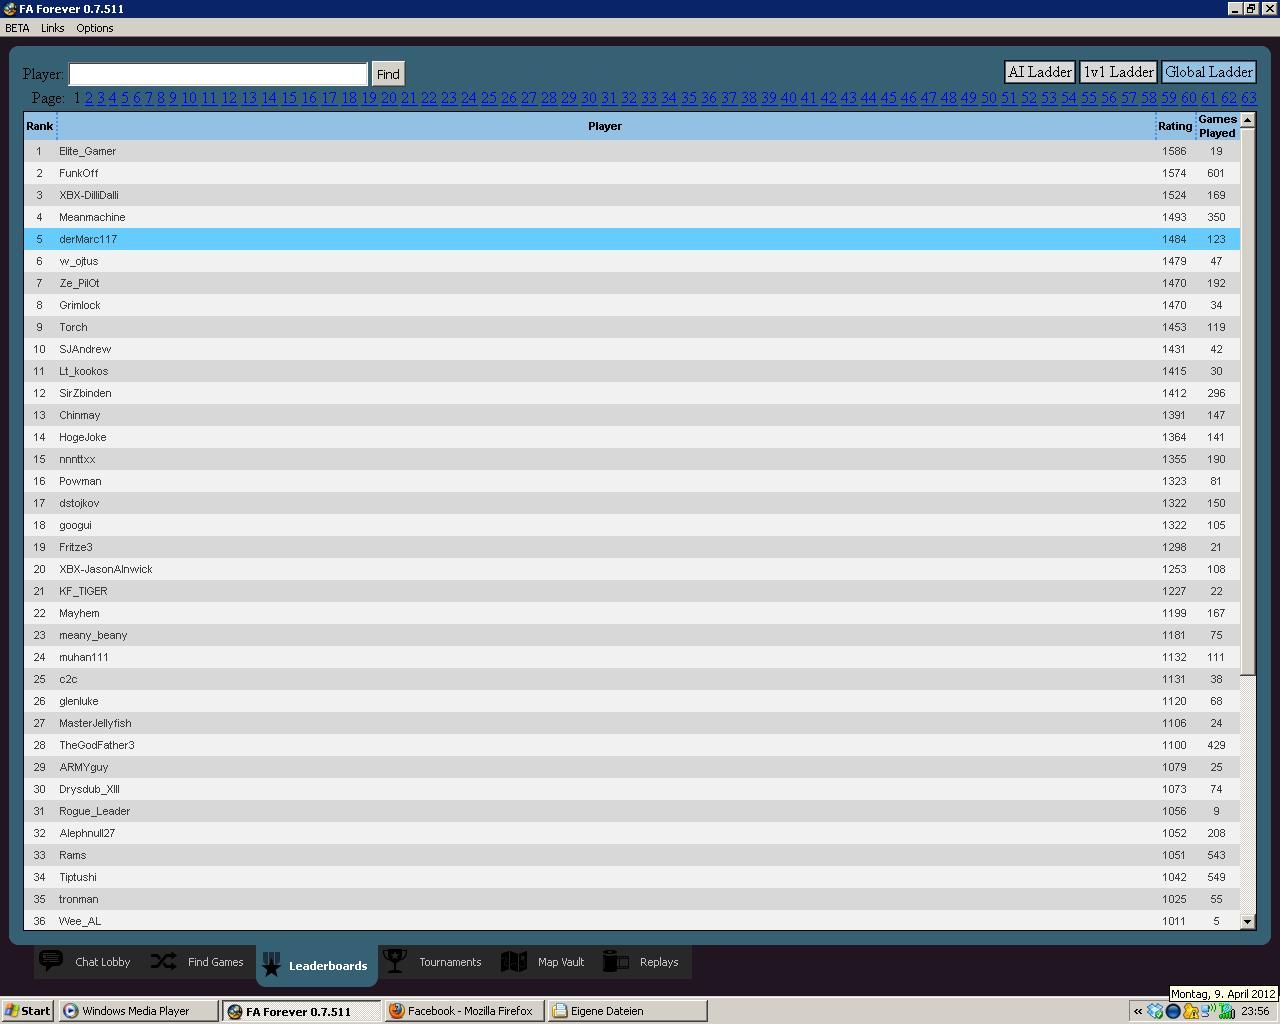
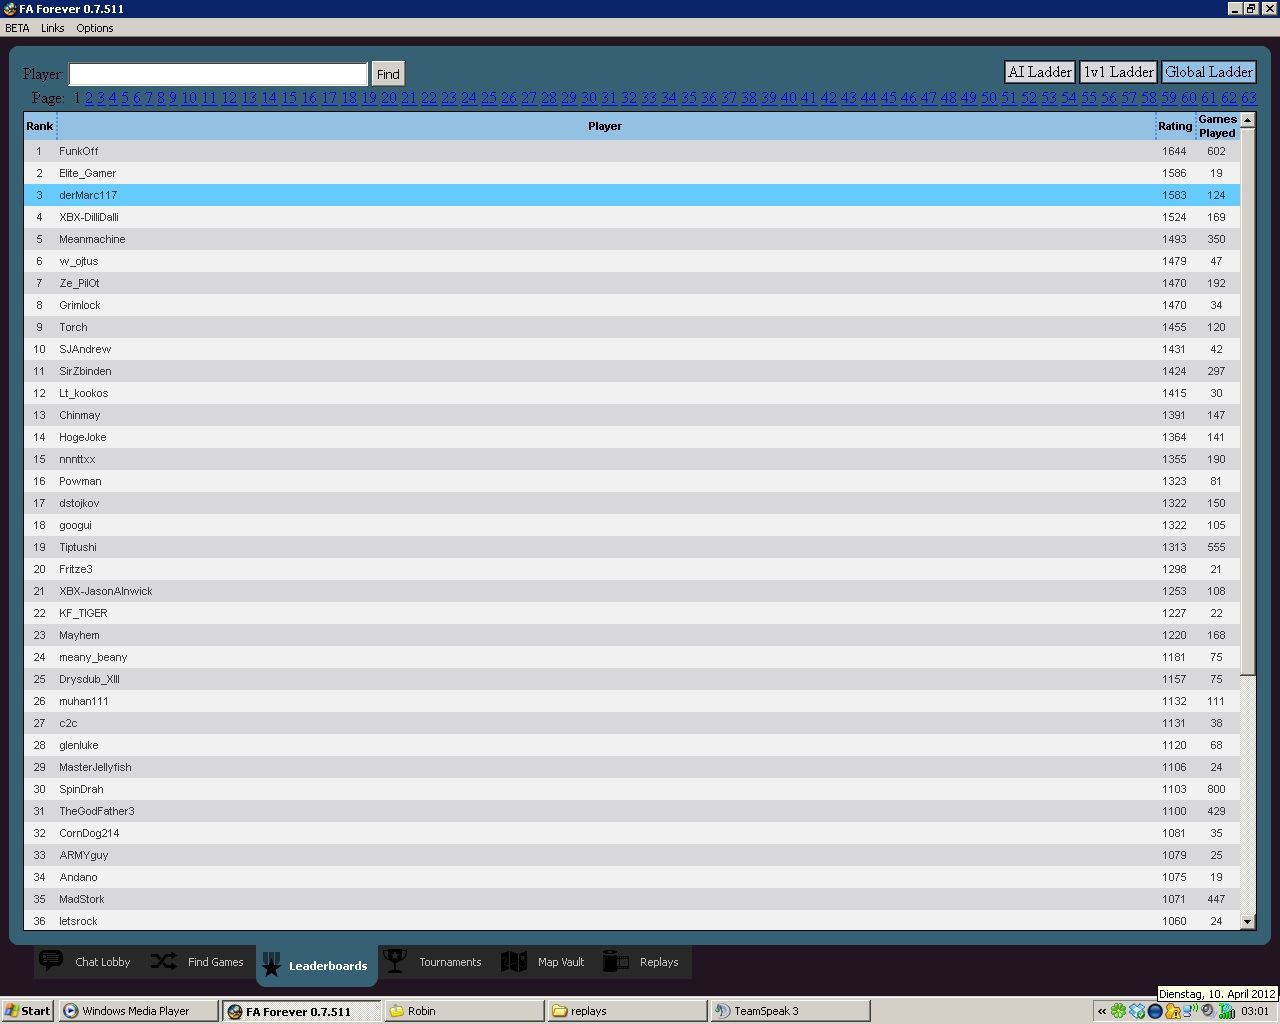
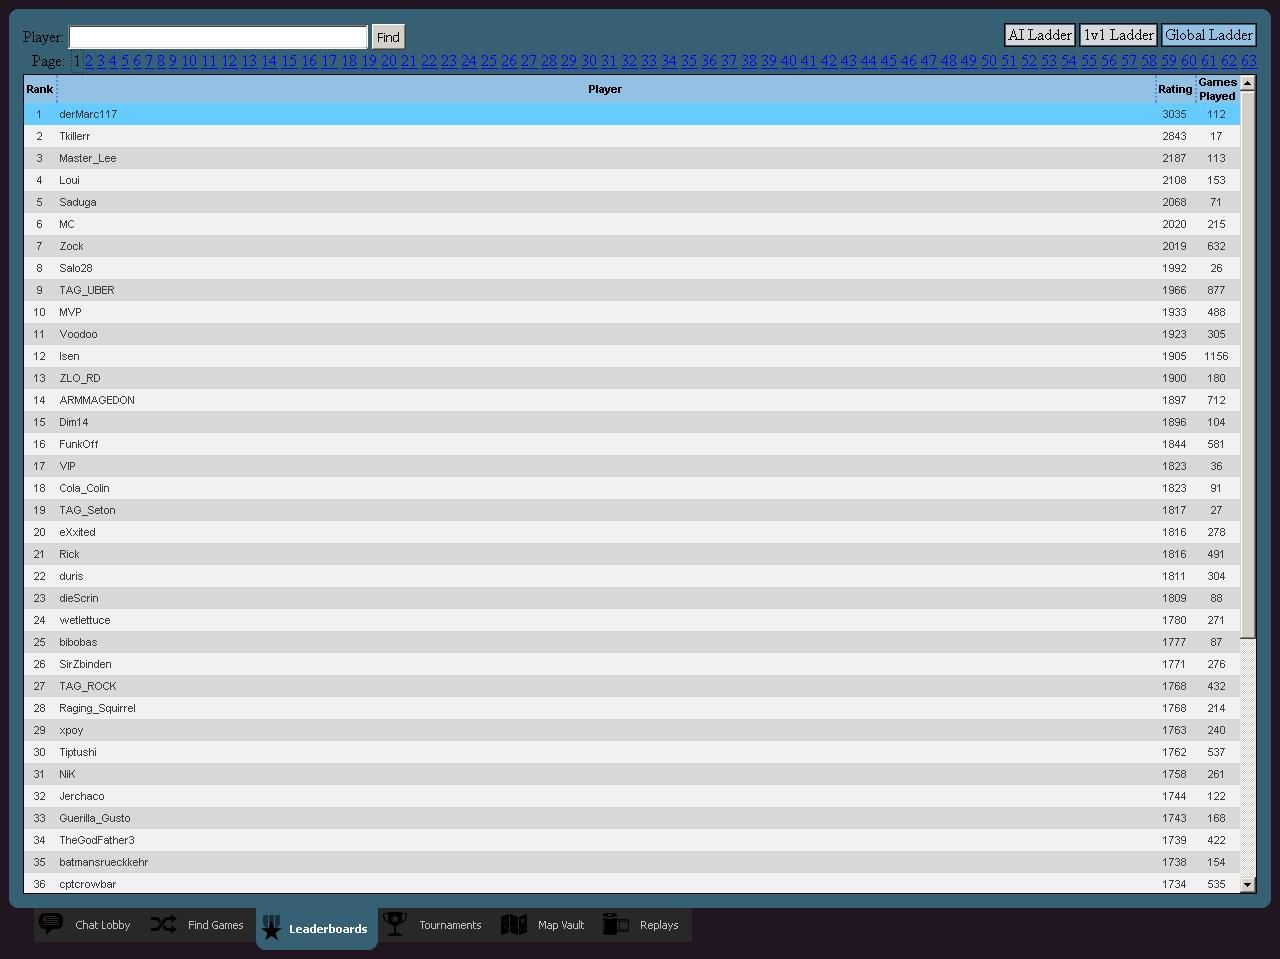
Okay I have been digging in my old drop box account. And found some rather dated screenshots.
They are the real deal though, Windows XP, ICQ in the system tray and even a date on two of them: 9th and 10th of April 2012.
FA Forever in version 0.7.511.

Check these ancient relics:
-
@derMarc117 Nice one! A bunch of those players are still hanging around from time to time. @zlo
-
I IndexLibrorum referenced this topic on
-
 M maudlin27 referenced this topic on
Hello! It looks like you're interested in this conversation, but you don't have an account yet.
Getting fed up of having to scroll through the same posts each visit? When you register for an account, you'll always come back to exactly where you were before, and choose to be notified of new replies (either via email, or push notification). You'll also be able to save bookmarks and upvote posts to show your appreciation to other community members.
With your input, this post could be even better 💗
Register Login