FAF Statistics Megathread 2 Statistics Boogaloo
-
Over the past few months, I’ve been digging into various aspects of FAF data — initially for moderation-related purposes, but the scope quickly grew into a broader analysis of FAF player activity, rating dynamics, and behavioral trends.
This thread can be considered an unofficial continuation of an earlier post by @tatsu from back in 2020, which itself was a continuation of the thread from 2012 on the old forums. See: FAF Statistics Megathread and FAF stats (old forum).
I will start with a general introduction to the data sources, goals, and some of the quirks that come with working with FAF’s historical records. I will also explain what data I have collected. If you have suggestions on further statistics or visualisations based on this data that I have not yet included, comment your suggestions and I'll have a look.
Future posts will dive into specific topics, with accompanying visualizations and summary tables.
Goals
This thread visualizes various statistics based on data pulled from the Forged Alliance Forever database through the API. This data was collected with the aim of getting a clearer understanding of the FAF player base and its interactions with moderation. The goals of this analysis were:
- Track trends in active player counts and rating distribution — who’s playing, how much, and how the landscape changes.
- Identify long-term trends in player retention, smurf behavior, and rating inflation/deflation.
- Explore moderation data to better understand the volume and nature of reports, bans, and appeals.
- Provide data-backed insights for both community discussions and FAF governance (e.g. balance, matchmaking, moderation policy).
- Improve transparency by publishing findings, allowing others to cross-check and build upon them.
This data may guide future efforts by the various FAF teams, including for example the promotion team and the moderation team.
Data description
Overview
This analysis draws on three primary datasets: players, reports, and bans, containing data starting from the beginning of the FAF project in February 2012.
Players data was collected from the API’s /data/players endpoint and contains information such as the account registration date, username, and playerID. This data was combined with select data from /data/gamePlayerStats, which contained information about which players played in which games and /data/leaderboardRatingJournal, which contained info on player ratings. By combining these, further information such as the date of the last played game, the number of games, the lifespan of the account, or the time it took for a player to play 10 games was calculated.
Reports data contains all the metadata related to reports, including report status (whether the report was discarded or completed, for example), the IDs of the reporter and reported players, the report description and game, and which moderator handled the report.
Finally, information from the bans dataset contains all related metadata including the ban reason, duration, and category.
A complete list of the variables for the three datasets will be posted below.
Data acquisition
Data was collected through the FAF API using a number of custom python scripts. Specifically, the endpoints /data/bans, /data/moderationReports, /data/players, /data/gamePlayerStats, and /data/leaderboardRatingJournal were used to collect all existing data. Together, this resulted in about 50GB of data in JSON format, which was later processed to CSV format.
Some of these endpoints cannot be fully accessed without an authorization token with at least moderator privileges, as some endpoints—the data/players endpoint in particular—produce data that contain private information that falls under GDPR regulations. In line with GDPR guidelines on data minimization, data such as player emails or steam-links were not collected.
Unusual features of the data
Due to a number of reasons, some of the data in these datasets does not follow expectations. Examples include:
- While most playerIDs correlate with account age, this is not the case for all playerIDs. Especially for accounts made in 2012, though also at later dates—at least up to 2016—it may occur that younger accounts have a lower ID than should be expected.
- Some data on user accounts was not properly recorded until February 2016.
- While bans were given out prior to May 2017, these dates have not been recorded. Rather than having been left empty or filled with a placeholder value, these dates were apparently set to 2017-05-10. As the ban expiry date was properly recorded, some bans have a negative 'ban duration' value.
- While the time of creation for a report was recorded, the update time was not. Consequently, for reports that were discarded and thus do not have an associated ban—from which the update time can be derived based on the ban’s creation date—it is impossible to determine when they were processed.
- Because of the various data artifacts that are present in the players dataset, for several graphs the choice was made to exclude all data from before March 2016. This will be mentioned alongside the graph when applicable.
Data accessibility
As it has been longstanding moderation policy to not share the details of reports and associated bans with the wider public, the datasets collected for the analysis of moderation-related statistics will not be released. If you're part of a FAF project (e.g., balance, moderation, events) or just an interested player and would be interested in access to more detailed data, feel free to reach out. I’m happy to provide anonymized raw data segments on request if you want to dig deeper or cross-check any findings.
Data analysis
Data was processed, analyzed, and visualized using a combination of Python and R scripts, with a lot of help from ChatGPT (I suck at programming). I may at some point release the relevant code to Github when I can be bothered to clean the code enough to be presentable.
List of collected and calculated variables:
Dataset Columns players player_id, create_time, last_login, username, has_accountlink, games_played, first_game_time, last_game_time, tenth_game_time, hundredth_game_time, thousandth_game_time, time_to_10games, time_to_100games, time_to_1000games, create_year players_by_bracket year_month, rating_bracket, active_players_10games players_all_ratings player_id, latest_rating bans ban_id, level, player_id, ban_create_time, ban_expires_at, ban_reason, author, revoke_reason, revoke_time, related_report, ban_revoked, ban_duration_days, units, ban_permanent, ban_category reports report_id, report_status, reporter_id, reported_user_ids, report_description, game_incident_timecode, game_id, moderator_private_note, moderator_notice, last_moderator_id, create_time, related_ban_id, last_moderator_name, ban_create_time, ban_expires_at, ban_reason, ban_revoked, time_to_ban games replay_ID, end_time, lobby_name, start_time, rated_validity, victory_condition, host_player_ID, gamePlayerStats_IDs Gamestats gamePlayerStatsIDs, rating_deviation, rating_mean, player_color, player_faction, score_time, team, replay_ID, player_ID -
Analysis: Playerbase
User registrations
Based on the data from March 2016 onwards, FAF has gained on average 2668 (+/- 678) new users every month. Month by month numbers fluctuate significantly, possibly in response to the SupCom:FA game being sold with a discount, or due to the effect of third party promotions such as game casts and tournament streams.
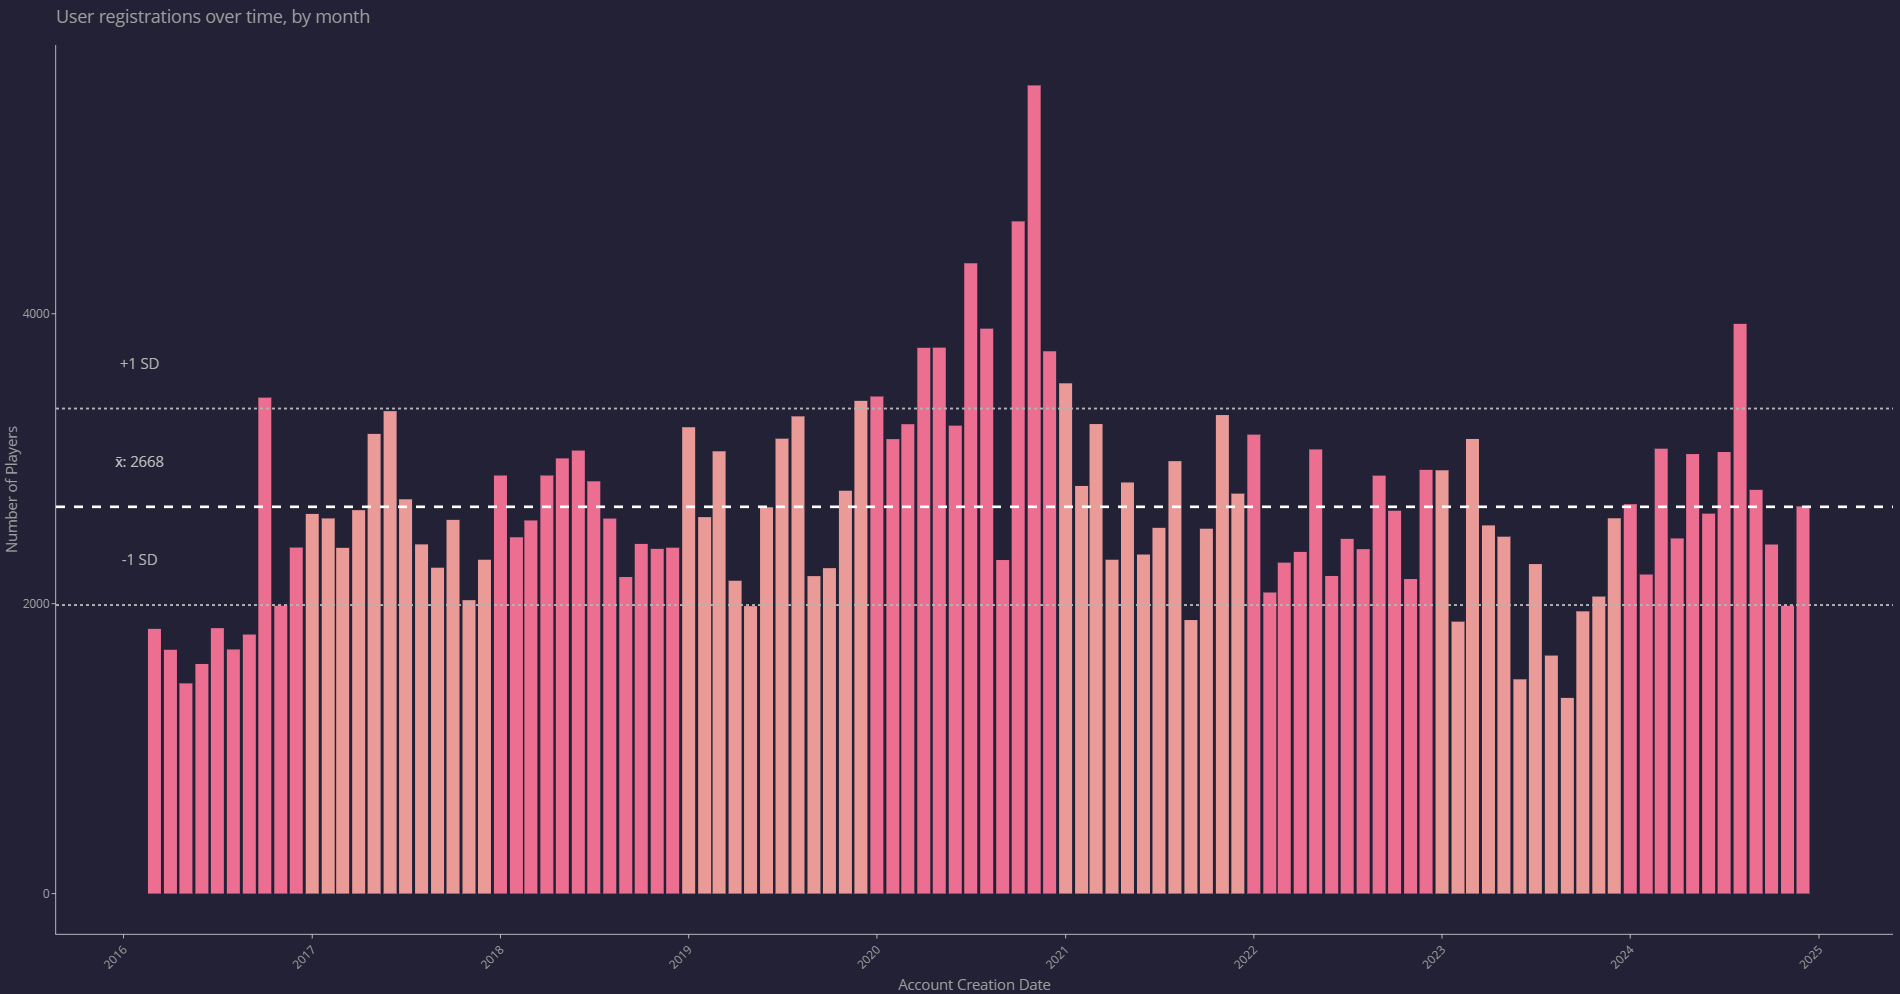
Graph 1: Count of created accounts by month. The data for February 2016 was not shown as its value was a significant outlier (12666).Yearly registration numbers have been fairly stable at around 28000 since at least 2017. However, the effect of the corona pandemic is distinctly visible in the significant increase in new users in 2020.

Graph 2: Sum of created accounts by year. Peak of the pandemic lockdowns happened in 2020. Data for February 2016 not included.Another way of visualizing this data is to show the cumulative registered users.

Graph 3: Cumulative registered users over time. Data for February 2016 not included.
From these graphs we can conclude that FAF continues to have a relatively stable influx of new players.User activity
However, registration does not equal activity. In fact, a significant portion of the users that register an account never log in, register a steam account, or play more than a few games. To visualize this, in the graph below accounts are divided in 7 bins: the accounts with no steam or GOG link, accounts that are linked but played 0 games, and accounts that played at least 1, 10, 100, 1000, and 10000 games. This data is then plotted as absolutely numbers of accounts (first graph) and as the proportion of the total accounts registered that month (second graph), visualizing the shift in total number of games played for the accounts over time.
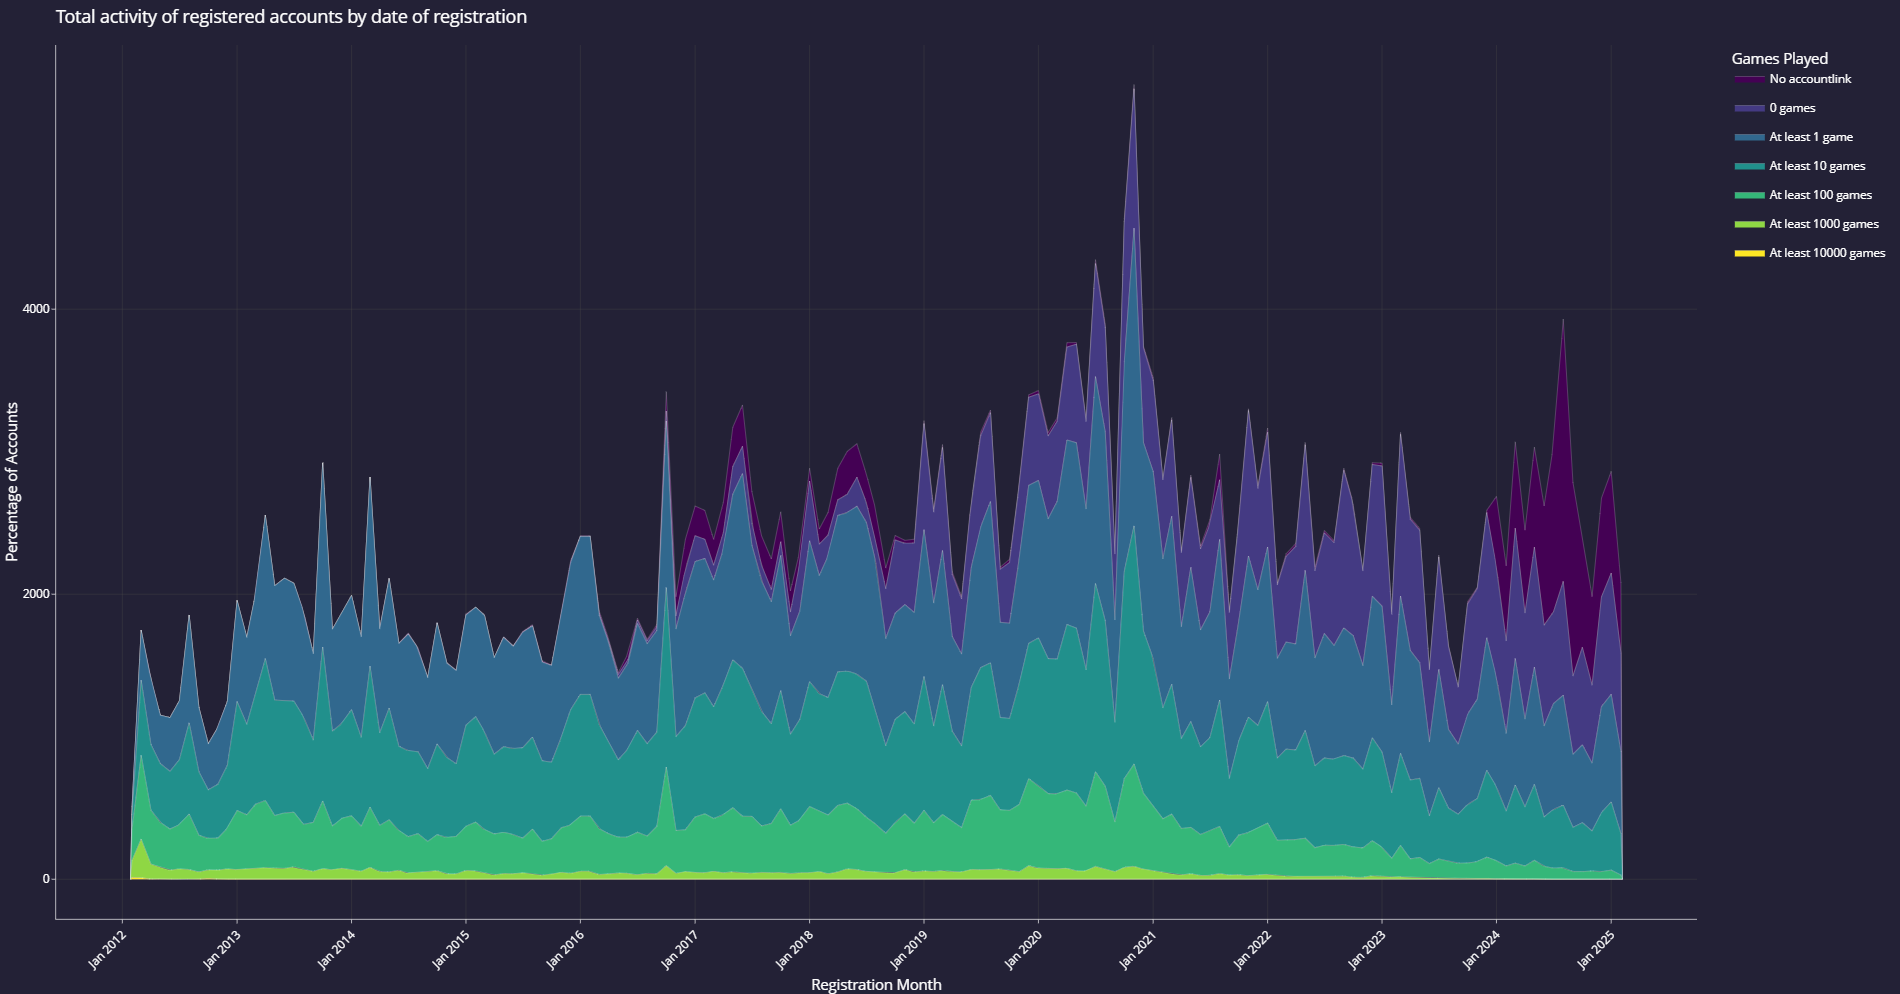
Graph 4: User activity up to April 2025 by date of registration
Graph 5: Proportional user activity up to April 2025 by date of registration.For each month the accounts registered in that month are divided in categories based on the number of games they played up to now. These values are plotted as proportion of all accounts for that month.
A few things immediately jump out. Because newer accounts will have had less time to reach a lot of games, the proportion of games with higher number of games decreases as the accounts get younger. Those rare few accounts with more than 10,000 games, for example, are all registered before 2020, with most of them having been registered in the first 2 years of the FAF project.
Another noteworthy observation is that the proportion of accounts without an account link—that is, accounts that were registered but never were connected to a steam or GOG account and thus cannot play any games—has significantly increased since 2024. These accounts may not be genuine accounts, and instead be the result of attempts at breaking FAF services (related to the DDOS attacks FAF has been experiencing since around that time) or attempts to create accounts to spam the forums with spam and advertisements (as has been happening in the past).
Users and Players
It is noteworthy that there is a large proportion of users that have played fewer than even 10 games. To look at this further, it makes more sense to only look at ‘players’, which I here define as any account that has played at least one game.

Graph 6: Proportional player activity up to April 2025 by date of registration.This graph clearly visualizes how almost half of the playerbase have played fewer than 10 games: 44.2% of the total playerbase, and 49.5% of all players registered in the past 5 years. Moreover, this proportion seems to be increasing in more recent years, with as much as 60.6% in the last year.
For larger number of games this could again be explained as a result of new accounts not having had the chance to play a large number of games, but given that this data only includes accounts up to the 1st of March and thus all accounts are nearly 2 months old at the time of writing, it should not be excessive to expect players to have played 10 games.
Time to reach 10 or 100 games
That is an assumption, however. To verify this, the mean and median time to reach 10 or 100 games was calculated for all accounts that had played at least that many games. Some players represented outliers, such as those that registered accounts in 2012, but did not play more than a handful of games until more than 10 years later. Such outliers were removed by only analyzing the data from players who completed 10 games within one year of registering.
Table 1: Summary statistics for times to reach 10 or 100 games.
Year Time to 10 Games – Mean (SD) Time to 10 Games – Median (IQR) Time to 100 Games – Mean (SD) Time to 100 Games – Median (IQR) 2012 55.8 (87.5) 13 (58.1) 619 (887.9) 242.1 (599.5) 2013 37.2 (68.9) 7.8 (27) 645 (925.6) 191.6 (786.9) 2014 42.6 (77.2) 8.1 (31.3) 646.7 (850.8) 254.8 (810.5) 2015 45.9 (81.7) 8 (35.1) 628 (806) 267.1 (781.1) 2016 33.8 (70.1) 5.7 (18.8) 553.1 (701.1) 223 (732.5) 2017 35 (71.5) 6 (19.9) 501.8 (637.5) 202.4 (681) 2018 33.7 (70.7) 5.9 (19.1) 433.1 (543.5) 179.1 (587.9) 2019 38.3 (75.6) 6.3 (22.6) 360.7 (444) 166.2 (444) 2020 31.4 (66) 6 (18) 304 (382.2) 125.1 (375.2) 2021 33.3 (68.9) 6.2 (19.8) 264.6 (310.7) 132.9 (314.6) 2022 33.4 (68.2) 6.2 (19.8) 213.2 (249.6) 93.3 (276.7) 2023 34.3 (68.3) 7 (20.4) 174.5 (172.6) 104.9 (224.3) 2024 25.4 (52.6) 6.5 (16) 95 (86.7) 59.9 (92.7) All years 36.2 (71.6) 6.8 (22.6) 445 (646.4) 167.8 (494.9) A quick reminder for those who have forgotten their stats 101 course: the standard deviation (SD) measures the spread of data around the mean (the average). A high SD means there is a lot of variation in the data. When data has a lot of variation, it is often better to look at the median instead.
The median is the value that sits at the middle of the data. In this table, it represents the number of days it takes for half of the players to reach 10 or 100 games. The interquartile range (IQR) measures the spread around this middlepoint. It measures the range between the 25th percentile and the 75th percentile. Or, more simply said:
-
In 2024, the median time it took for players who played at least 10 games to reach 10 games was 6.5 days, with an IQR of 16 days. This means that 75% of all players that played at least 10 games, played them within 14.5 days after registration.
-
The median time it took for players who played at least 10 games to reach 100 games was 59.9 days, with an IQR of 92.7 days. This means that half of all players that played at least 100 games, played them within 106.2 days after registration. Incidentally, the fastest player on record to play 100 games after registration played those games within 0.2 days.
This data shows that there is a lot of variation in how active players are, but also shows that most players need about 6.8 days to play 10 games, and 167.8 days to play 100 games. The data from the table was plotted in the graphs below.
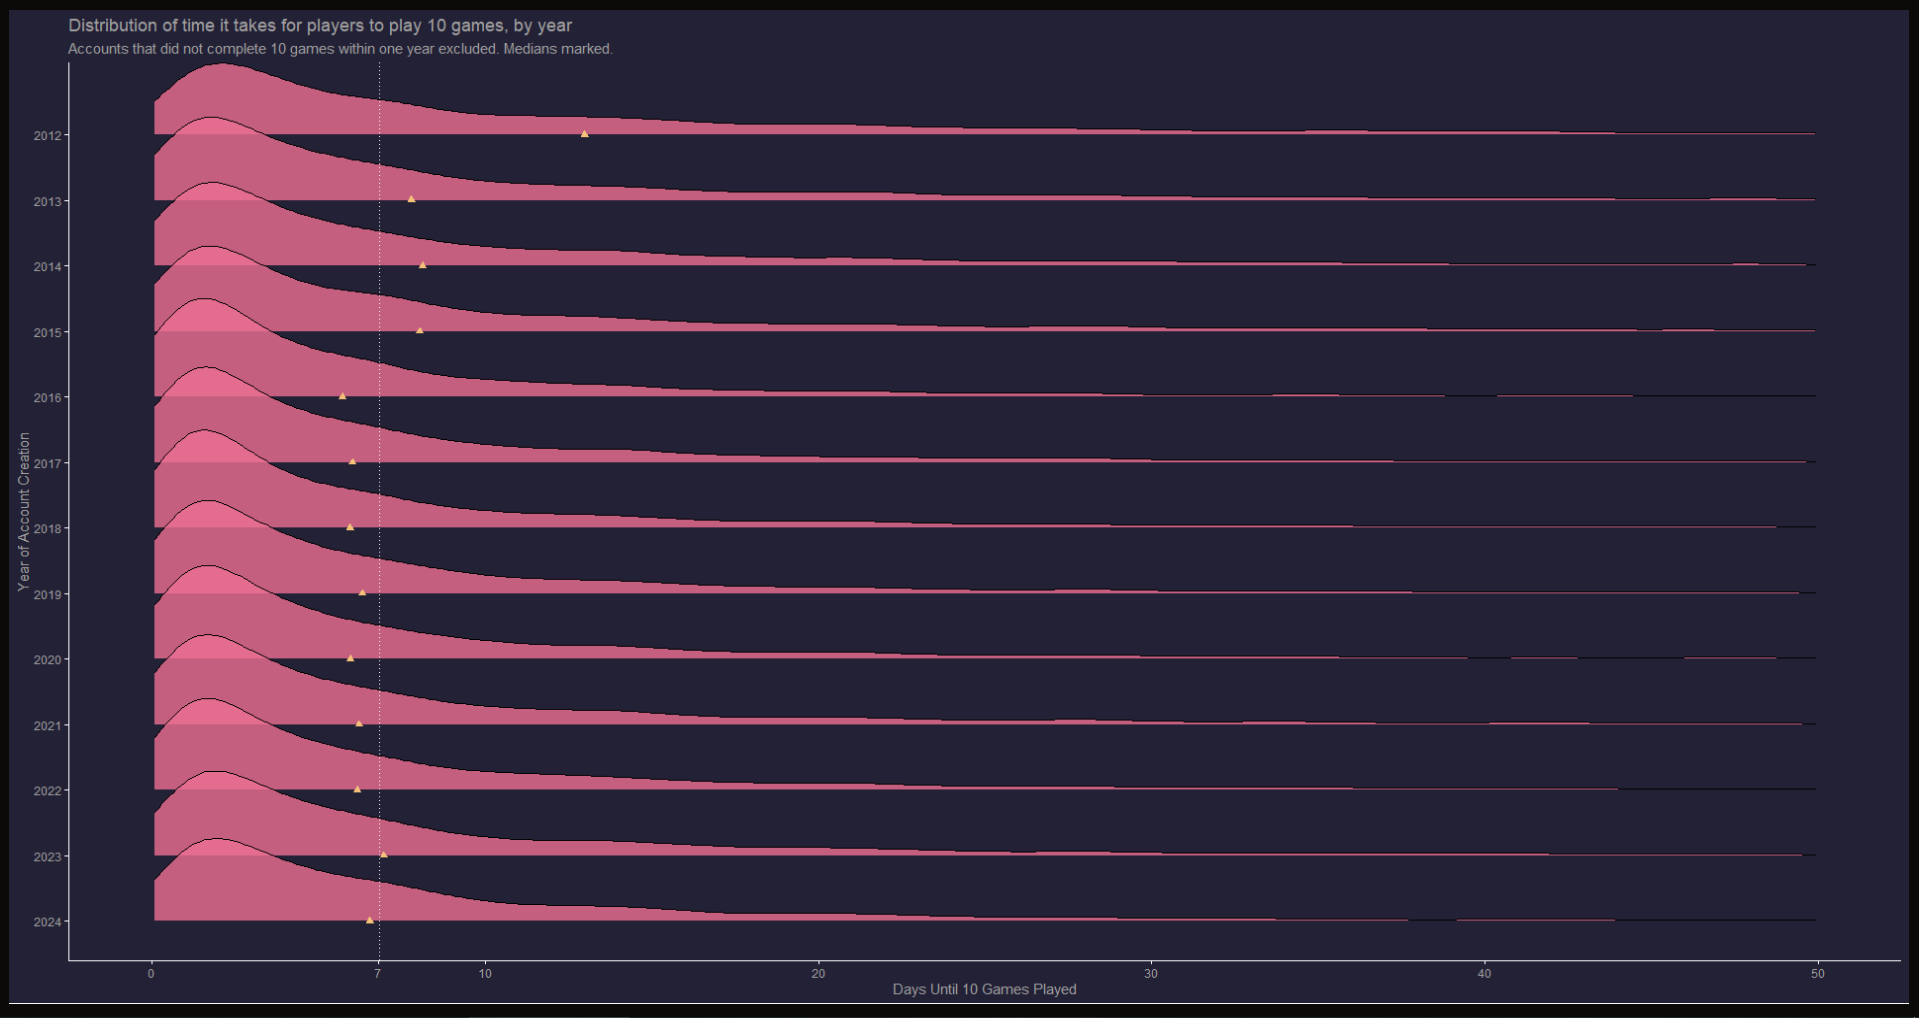
Graph 7: Distribution of time it takes for players to play 10 games, by year. Median marked.
Graph 8: Distribution of time it takes for players to play 100 games, by year. Median marked.From this data we can conclude that it is not unreasonable to expect accounts that are older than 2 months to have played at least 10 games. This means that the increase in the proportion of newly registered players in the last year that have not played at least 10 games to 60.6% is the consequence of other factors. There are several reasons for why this percentage has increased. One immediately obvious candidate is the connectivity issues that have plagued FAF in recent years.
While it is impossible to definitively determine what the reason is that players quit early on, at least without having these players full in a survey or otherwise directly asking them why they stop, we can have a look at some other data to see if the connectivity issues are the cause. The number and proportion of single-player games, coop games, and multi-player games may offer some insight, for example. Similarly, comparing the average duration for which an account stays active between players that near-exclusively play single-player and multi-player, as well as the change in this average over time, may be interesting. This data will be looked at later.
"Design is an iterative process. The required number of iterations is one more than the number you have currently done. This is true at any point in time."
See all my projects:

-
-
Great and long-waited work.
To visualize this, in the graph below accounts are divided in 7 bins: the accounts with no steam or GOG link, accounts that are linked but played 0 games, and accounts that played at least 1, 10, 100, 1000, and 10000 games.
Could you make the same graph but count only ranked (rated) games?
-
More to come over the days as I get around to finishing some graphs I already had ready, but the weather is nice this weekend so we'll see if I have the time.
@Sainse said in FAF Statistics Megathread 2 Statistics Boogaloo:
Great and long-waited work.
To visualize this, in the graph below accounts are divided in 7 bins: the accounts with no steam or GOG link, accounts that are linked but played 0 games, and accounts that played at least 1, 10, 100, 1000, and 10000 games.
Could you make the same graph but count only ranked (rated) games?
Yes, I didn't note it in the first post (I'll edit it later to include) but I also have all the end-of-game reports that include things like factions used, game validity, gametime, and whether it was ranked or not. I'll make some graphs related to that info soon. It'll be interesting to see the activity of rated games and compare them to co-op games and solo-with-AI games.
-
Very interesting, thank you!
Faf doesn't welcome or tell the newbie in any way (maybe I don't remember and there is such a thing)
In almost every game before you can click play you get 200 notifications with information
Maybe we should make at least 2-3 such notifications with information (where it would be written that here is a different balance, not like in steam and links to all possible training, discords, guides, popular streamers and so on).Sorry for my English. I use translator
-
-
@Skrat I've heard several people talk about producing tutorial levels. I think that would help to some extent.
-
Hello
I have been playing strategy games for a long time, since 2001
In 2007 I came across Supreme Commander
First I completed the campaign and I really liked the game
And then I somehow forgot about the game, since at that time in our region there was almost no Internet, if it existed at all
Then I played StarCraft II and accidentally saw on YouTube how someone was playing Supreme Commander with other players, it was Yuri The Professional
Through his channel I learned about FAF Client, found an old disk with the game activation code and brought it to Steam
I subscribed to all the streamers and to this day I try to please them and create activity on their channels to promote and popularize the game Supreme Commander
I think that many young players come to try the game and for them online battles seem a little complicated
Since I conducted experiments on my son, he played Supreme Commander and for a very long time understood where everything was, it took him at least 2-3 days to more or less figure it out, at the time of writing he was 13 years of experiment.
I think players really need to play the whole campaign or play with players of their level. Everyone, especially kids, wants to win and win right away at the beginning. I think newbies should be given that opportunity.
Thanks for the stats, I found it interesting -
more !
-
The campaign also serves as a tutorial (especially the original SupCom one), but on FAF it gets a little buried. On the play screen, there are usually games custom-marked for noobs, but even those are beyond the skills of someone who is just starting and may be offputting.
Also, there is no obvious button on the starting News screen to play a game. Some people might arrive and immediately get lost.
If there is a way to detect when someone opens FAF for the first time, it might be useful to provide some custom links, much more obvious than usual, to a tutorial level or at least a how-to-navigate-FAF video.
-
Can we get statistics for ban amount, appeal and successrate of the appeal?
-
@Deli I've got this data and made some preliminary graphs, but currently lack the time to work them out properly. It's on to-do list!
-
By @Fichom 's request I looked in some more data today and have some further graphs that look specifically at rating brackets. All of the graphs in this post can be clicked on to zoom in, since I exported them in a fairly decent resolution.
For these graphs the playerbase was split by their global rating in brackets of <500, 500-1000, 1000-1500, 1500-1800, 1800-2000, and >2000.
The first graph plots the number of active players (with at least 10 games played in the past) over time per month, and breaks them up into rating brackets.

Graph 9: Active players with more than 10 games by Global rating bracket per monthYou can clearly recognize the Covid peak on this graph, which then drops down again. The highest rated players are a minority, as can be expected. Zooming in on the last 5 years, we can get a bit of a better look at the smaller populations:

Graph 10: Active players with more than 10 games by Global rating bracket, past 5 yearsIf you look carefully, you may spot that the quantity of high rated players (1800-2000 and >2000) has increased in the past 5 years. Looking at this data when we plot the brackets as a percentage of all players rather than quantity, we can see that the proportion of 2000 rated players has also slightly increased over time.

Graph 11: Active players with more than 10 games by Global rating bracket, as a percentage of total playersIt also is clear from this graph that most players have a rating lower than 1000. For a long time now people have considered players that are rated higher than 1500 to be 'pros', in no small part because Gyle started classifying them as such in his casts. The data doesn't disagree: less than about 10% of the player base is rated higher than 1500. The true professionals rated above 2000 are the top ~1.2% of players.
A cleaner view of the same data is shown in graph 12, where I split the data not by month but by year and plotted the data as stacked bars:

Graph 12: Active players with more than 10 games by Global rating bracket, as a percentage of total players, by year.Looking at this graph, it seems that the population of sub 500 rated players is the smallest it has been since the start of the FAF project. To compare how these proportions change over time I've unstacked the bars in graph 13:

Graph 13: Active players with more than 10 games by Global rating bracket, as a percentage of total players, by year over the past 5 years, unstacked bars.All categories above the 1000 rating seem to have increased somewhat over the past 5 years. Whether this is a sign of rating inflation is something someone smarter than me can argue for. The number of >2000 rated players specifically has increased significantly over time since the lowest number in 2017 however:

Graph 14: Number of >2000 rated players over time
Some further questions by @Giebmasse prompted looking into the number of games played by each bracket over time. Specifically, we were interested to see if 2k rated players, for example, would play significantly more games than could be expected from the number of players in that bracket.
First, looking at how many games were played by each bracket in the past 5 years:

Graph 15: Games played per global rating bracket per year since 2019As expected, the rating bracket with the most players also resulted in the most games played. Most games were played by the 500-1000 rated player group, and the fewest by the >2000 rated group. It is interesting to see how many games were played, however. The games plotted here were only the games from global leaderboard, and at the peak of 2020 well exceeded 3 million games played.
Lastly, graph 16 plotted the number of games per bracket normalized for the number of players in that bracket.

Graph 16: Average games played per player by rating bracket in the past 5 yearsThis graph shows clearly that higher rated players play, on average, more games than lower rated players. This is not unexpected: 2k's do not randomly pop into being, but are the result from continuous 'training' and playing games. While I am sure not everyone can become a high rated player, if you want to give it a try the best way to do so is to play more games. Naturally, the effect also work the other way around: players that are good at the game and enjoy playing it, play more.
Whenever I next have time I intend to have a look at moderation-related data.
-
@IndexLibrorum Awesome job, thank you!
Please make similar stats for 1x1 ladder
-
 S Skrat referenced this topic on
-
This data is then plotted as absolutely numbers of accounts (first graph)
The Y axis is "Percentage of accounts". What does 2000 percentage of accounts even mean?You've obviously wanted to write "Number of accounts" on this picture, not percentage.
-
@Sainse There's an error here and there in the labels, soz
-
Ranked (rated) FAF stats
Goals and methods
I would like to contribute by providing more graphs focused on competitive gameplay. So all images you are going to see are for rated replays. I've used the same API interface IndexLibrorum had described in the initial post. Thanks to him for helping out with the initial setup.
AI, coop, sandboxes as well as unranked games are excluded from my analysis. Data scope is between 1st January 2017 until 31st July 2025. It's about 23 GB of .json data later converted to .parquet for processing.
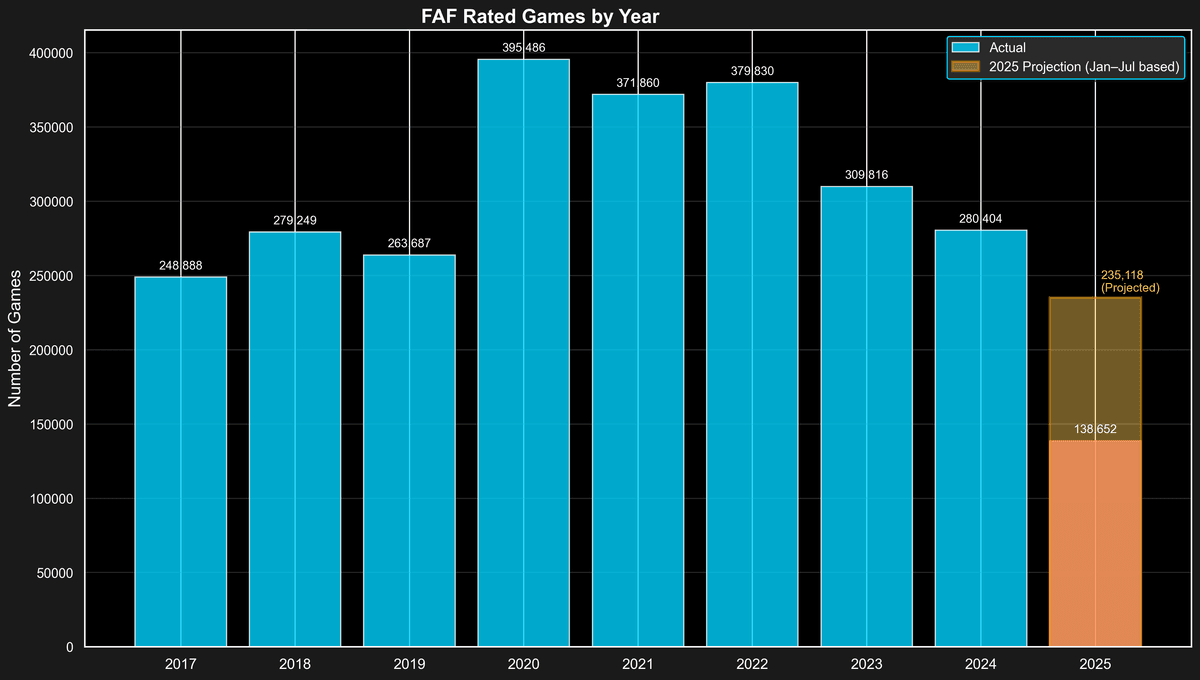
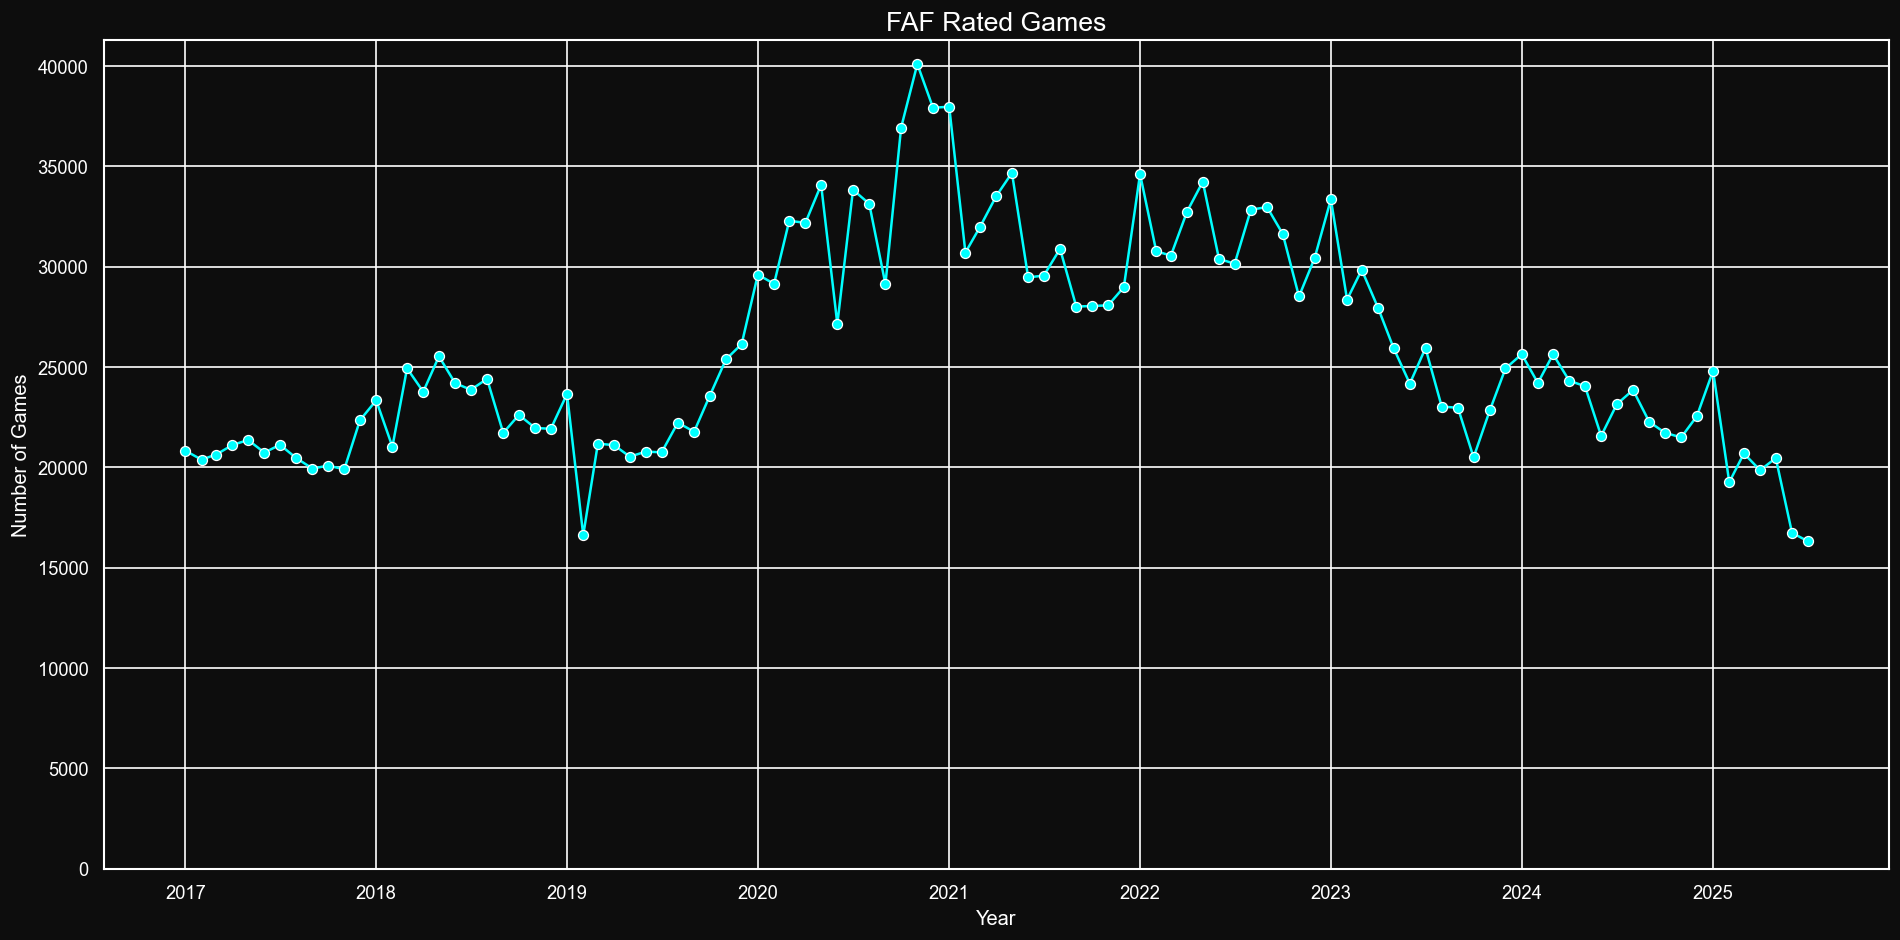
Total number of games
The total number of rated games on a yearly basis ranges between around 250k to 400k. FAF peaked at the middle of pandemic with 395k games played in 2021. In 2025 there has been 138k games played by the end of 31st July. On average around 60-65% rated games are played by this date. That allows to make an approximate projection that by the end of 2025 the amount of rated games should reach about 235k.
Total total numberof all FAF games in 2018-2019 was around 1.25 million. It allows to conclude that around 20% of FAF games are rated. However it does not mean that 80% of FAF is coop/ai/survival, as there are many more reasons for game to not become ranked, such as desync, con issues or being a sandbox game.
Rated games
The peak year was in 2021, but what about peak month? November 2020 with 40 099 games.
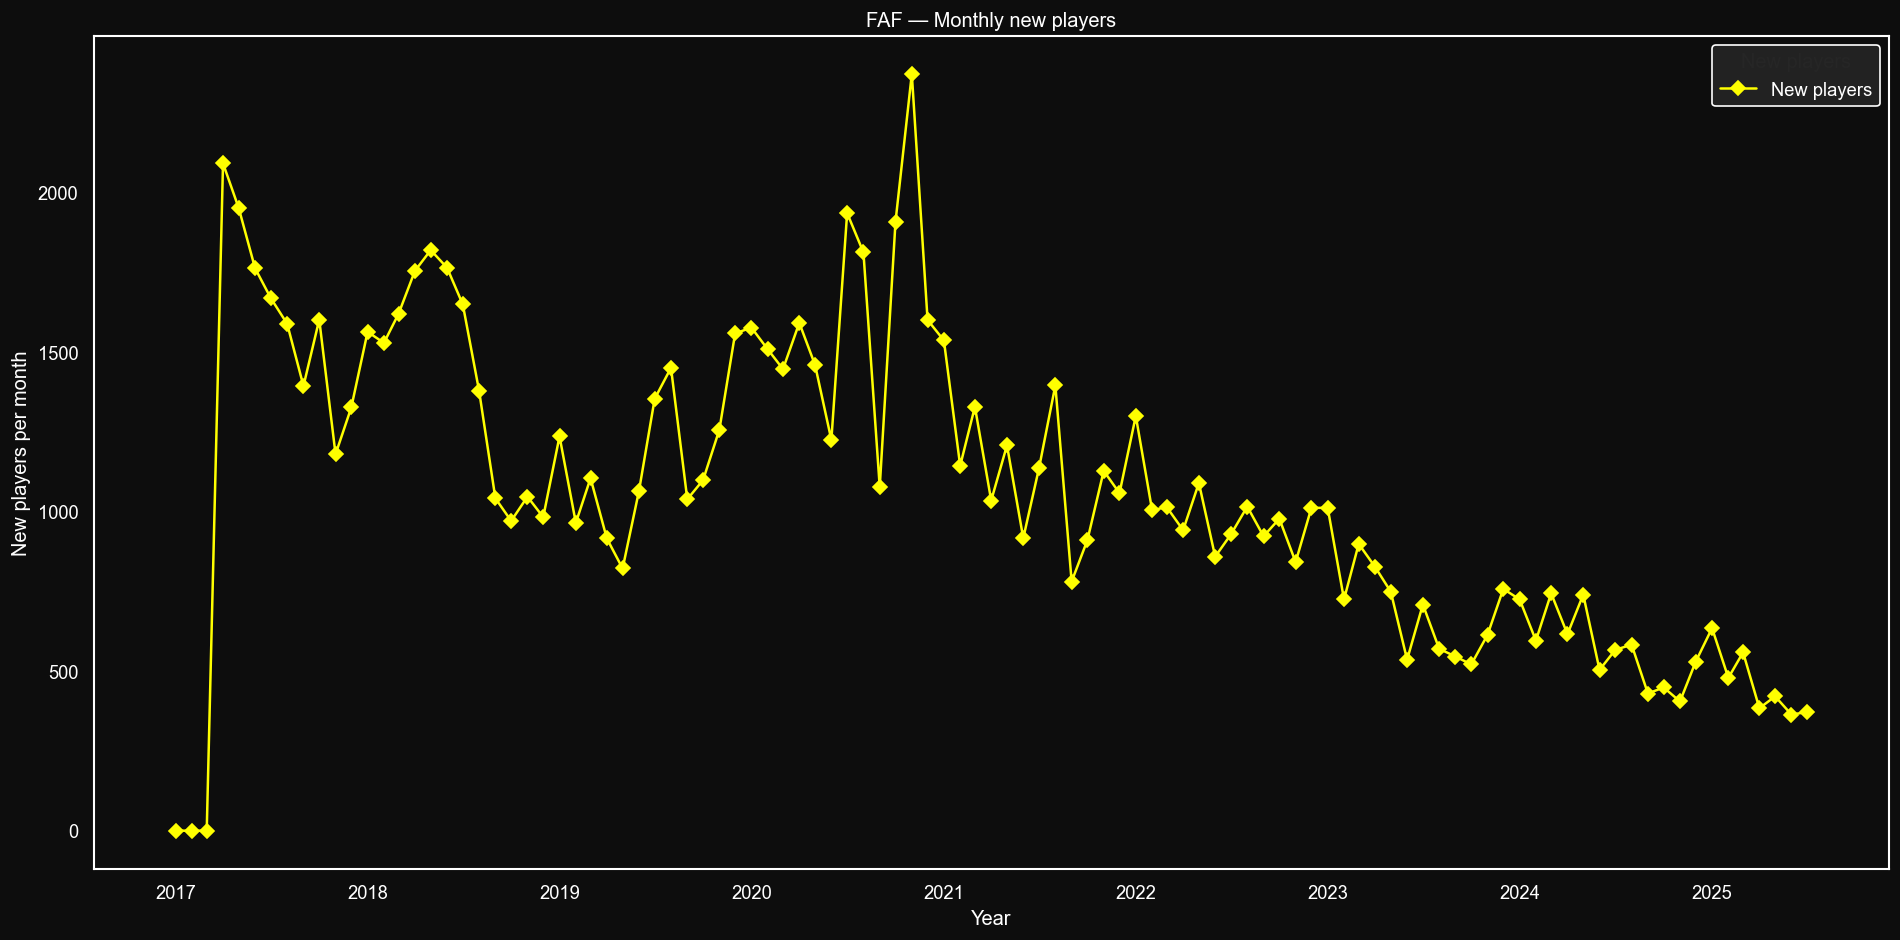
New players
The best way to "zoom in" new players dynamics without downloading pre-2017 data is to consider first 3 months players to be "old" players. This is still not accurate for first 3-6 months, but after that point it better shows ups and downs. You can see that amount of new players somewhat increased between 2020 and 2021, but not drastically if compared to 2018-2019 levels.
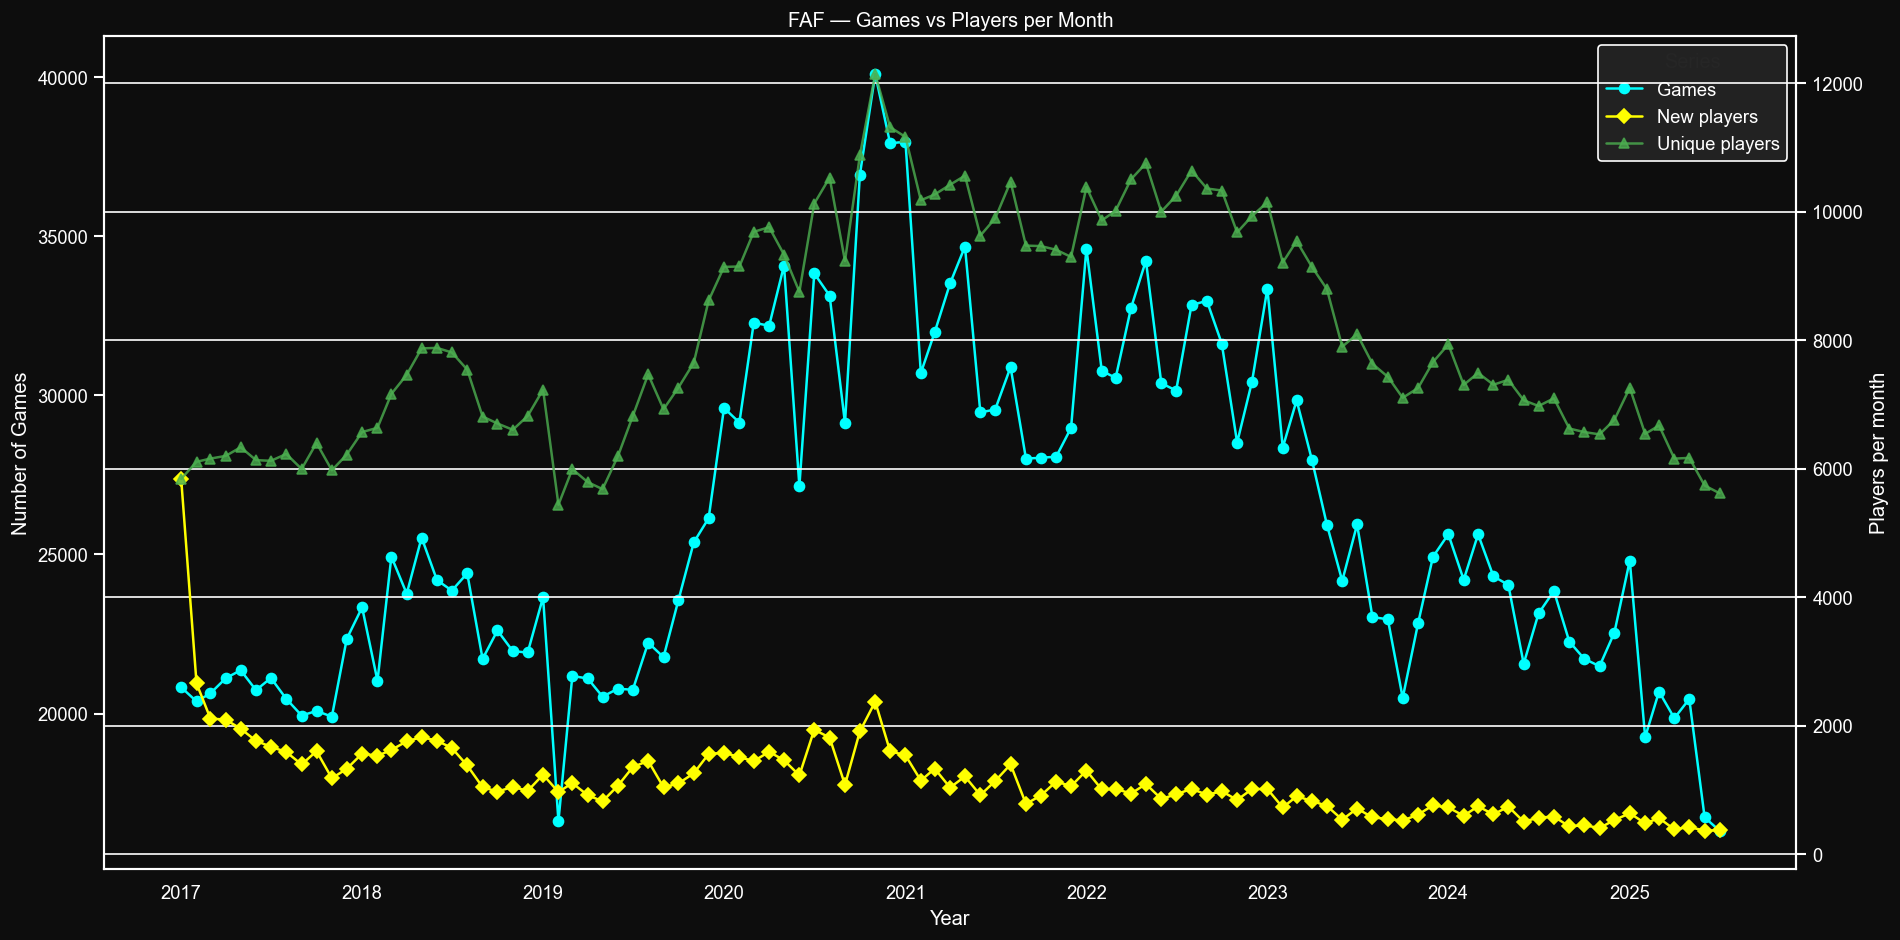
New and unique players
Note that the data points for new players aren't accurate for the first couple of months. The unique players are accurate for the entire image.

Players and ratings
Note that there are two Y-axis. The left one is number of games (tens of thousands and no less than 16k), the right one is amount of new/unique users (thousands).
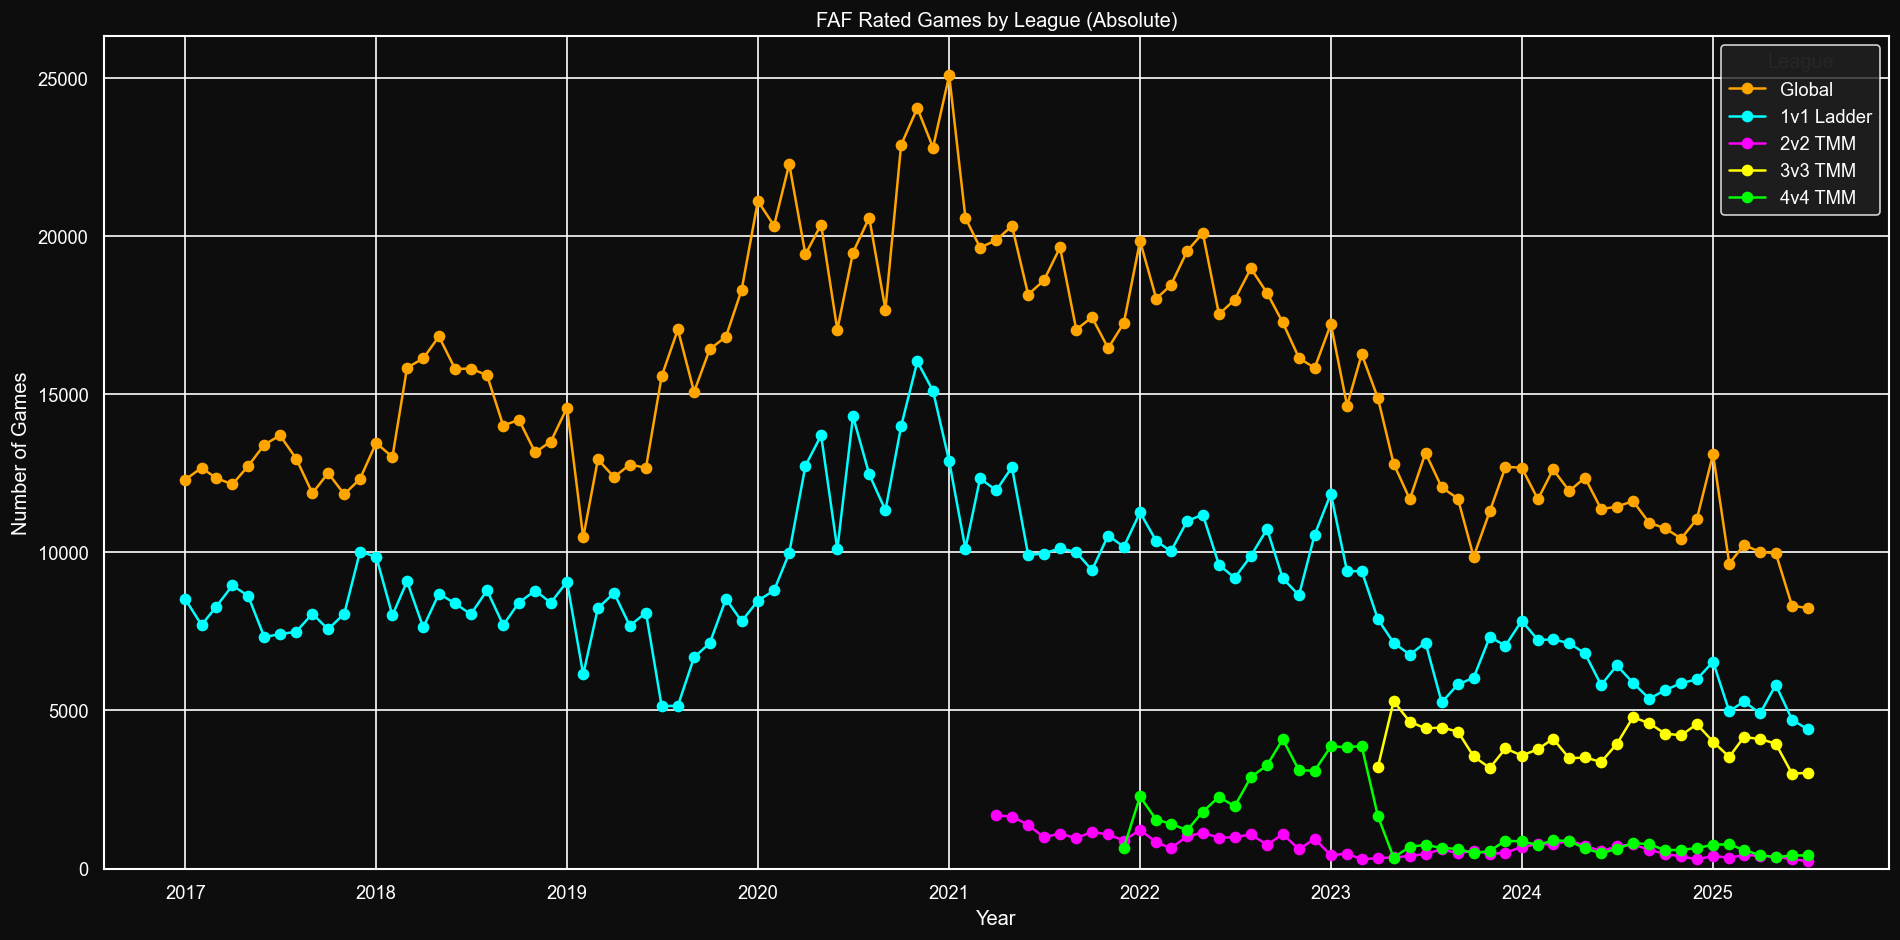
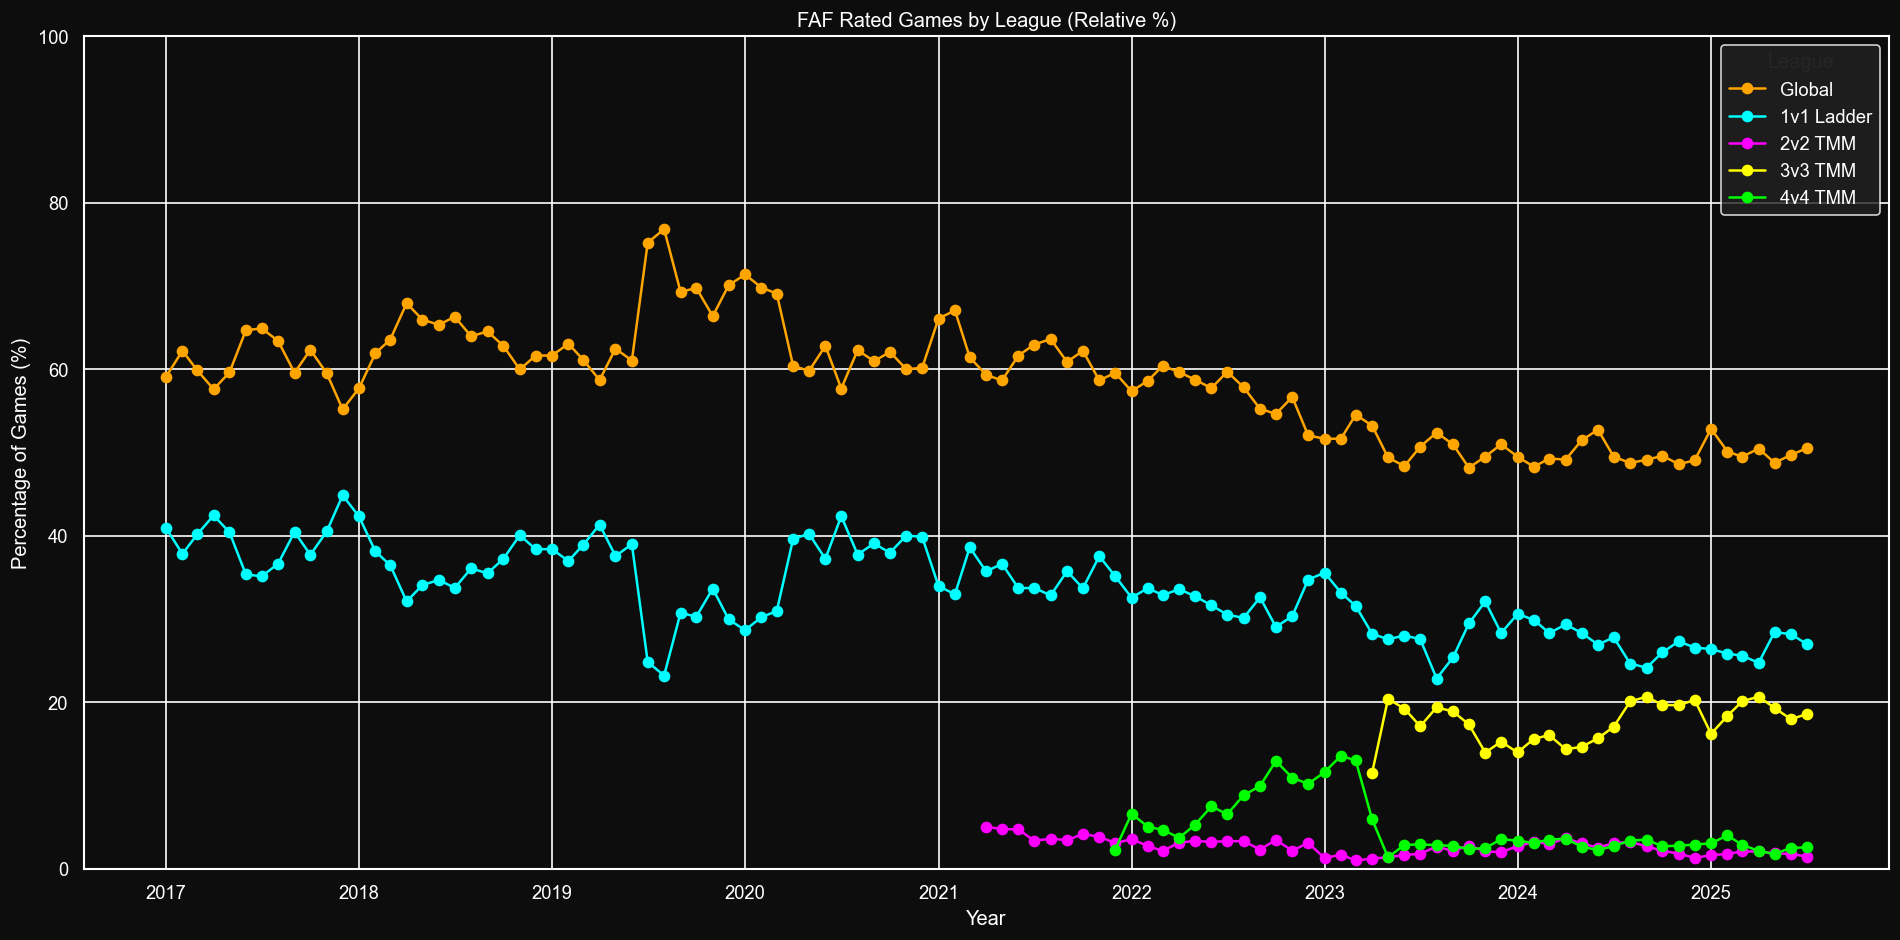
Leagues distribution
For simplicity’s sake I call game type/game mod/rating type a ‘league’. In the past the only game types were global and 1v1 ladder. In 2021-2023 to the matchmaker were added 2v2, 4v4 and last but not least 3v3. 2v2 never got any significant share of games. 4v4, on other hand, was pretty significant - until it got eaten by 3v3. Ultimately 3v3 TMM grabbed some share from global and 1v1.
Number of games
Percentage share
Global
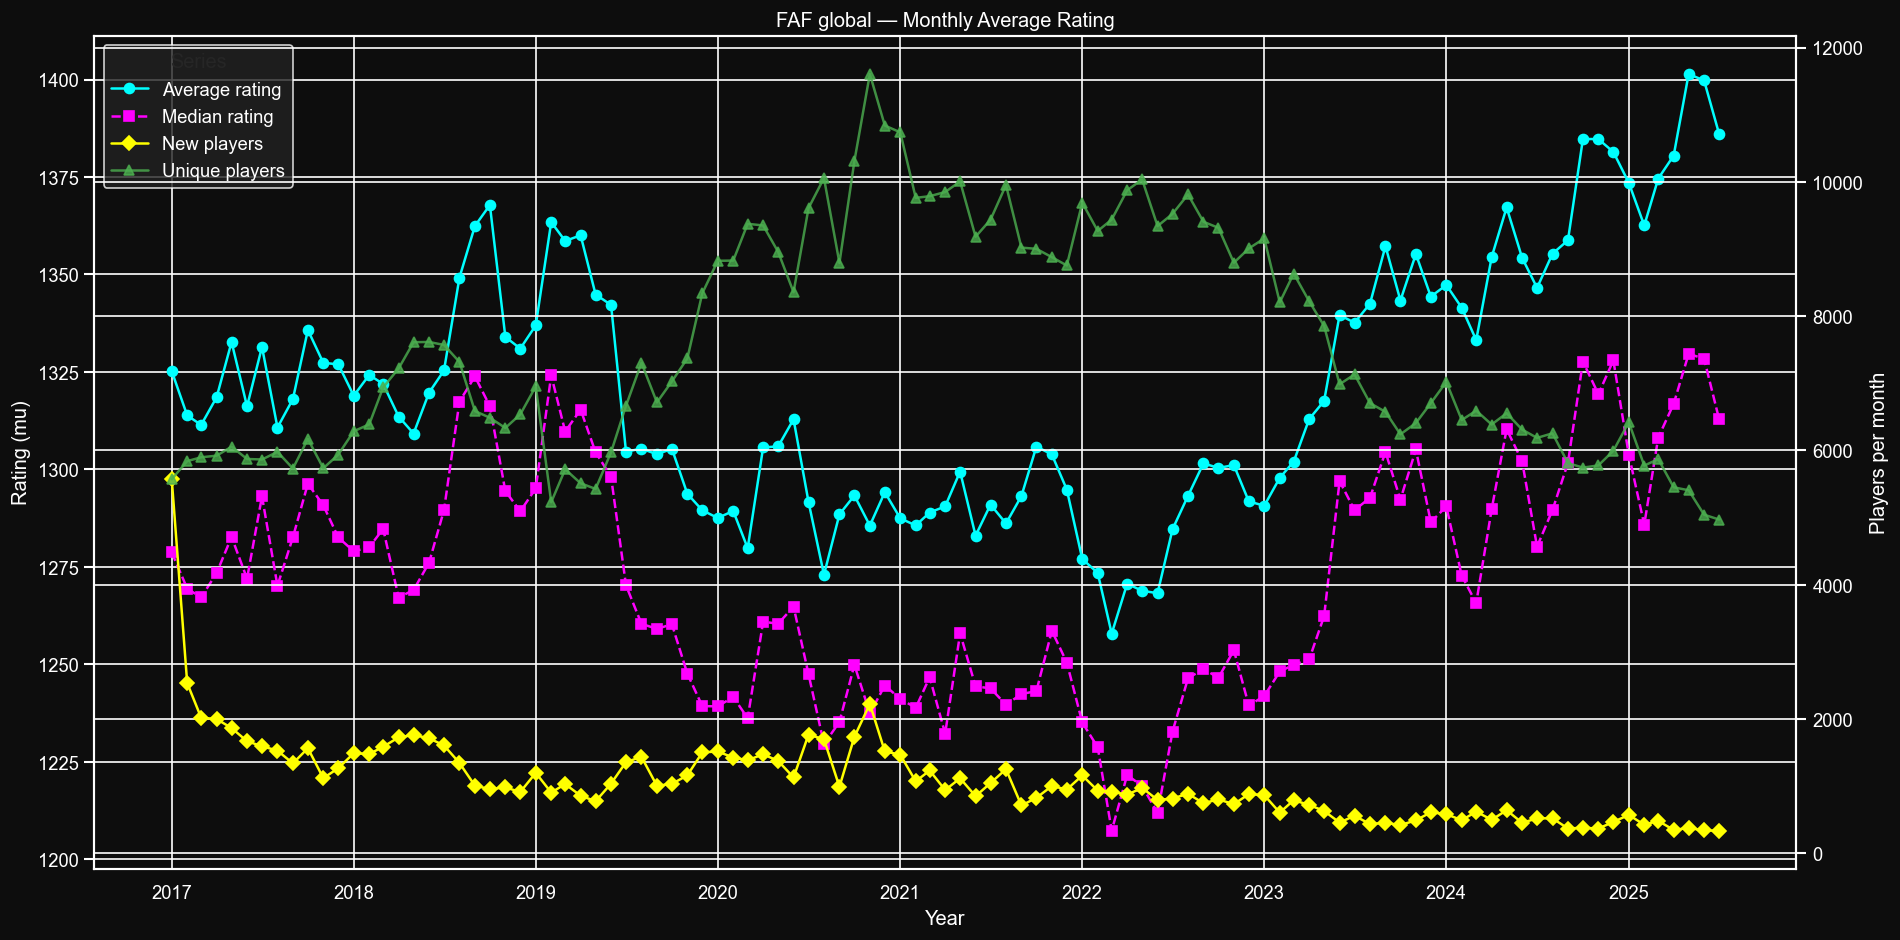
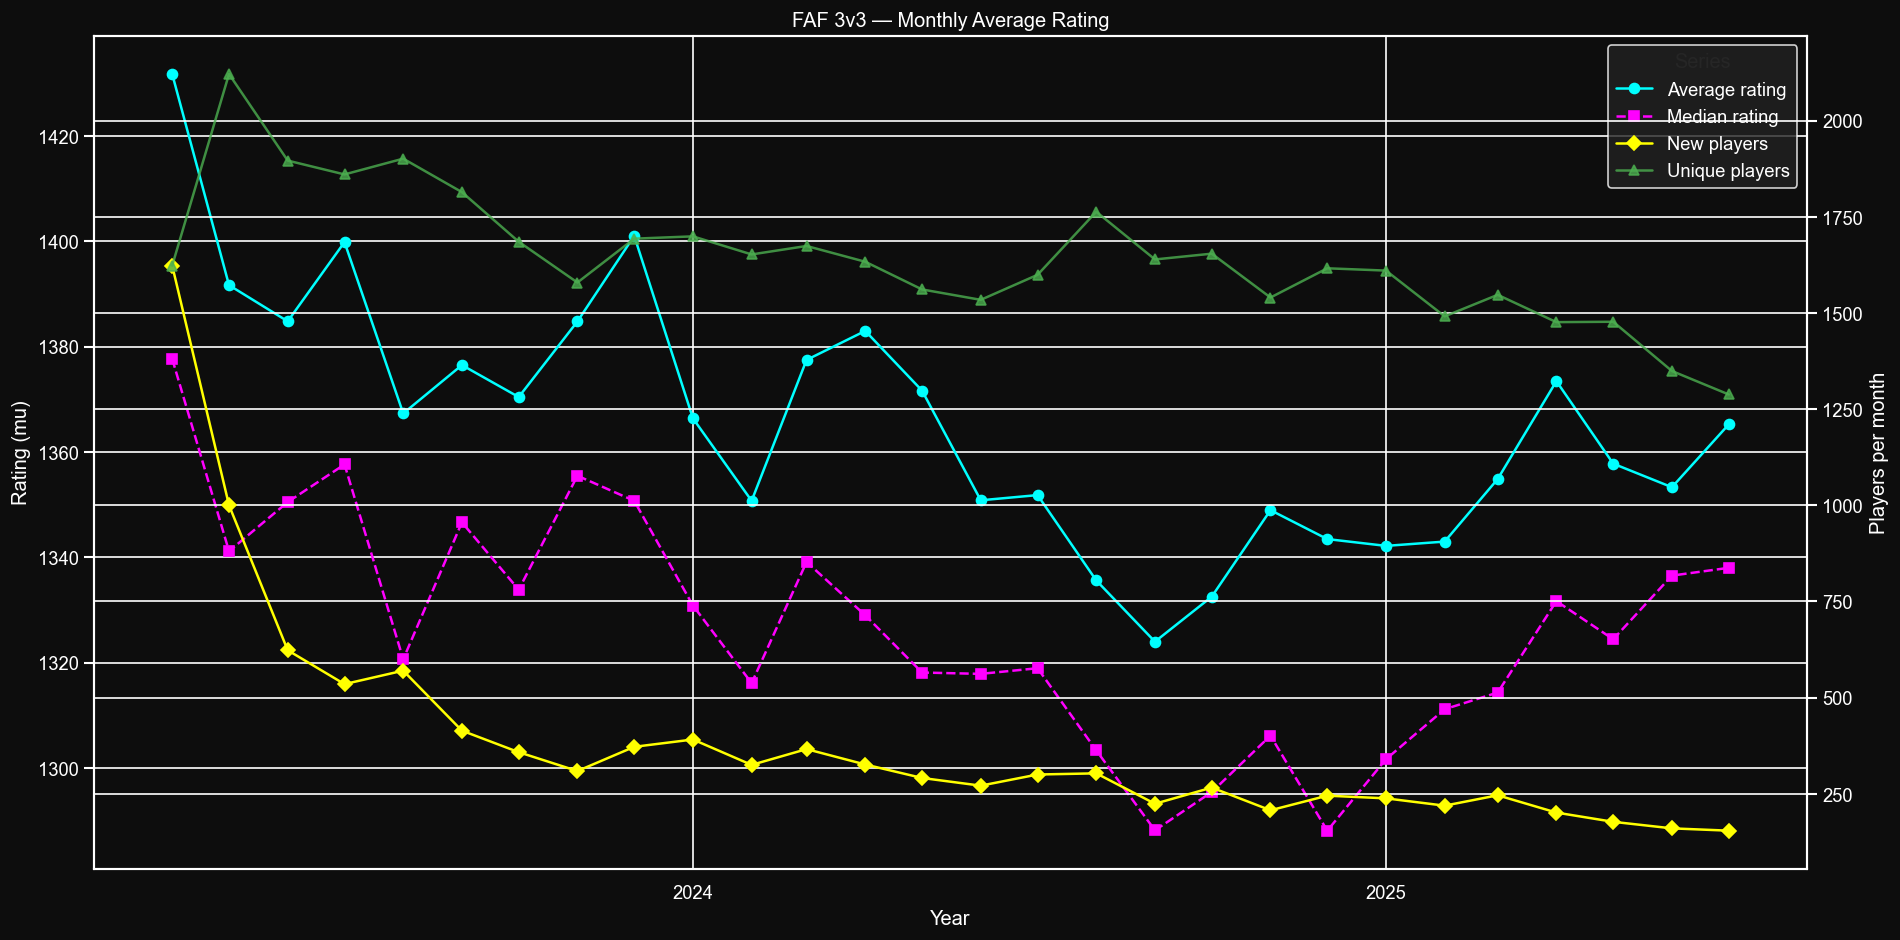
Note than median and average are not the same. Median means that 50% of players are below and another 50% of games are above median. Top players drive the average significantly higher than median.
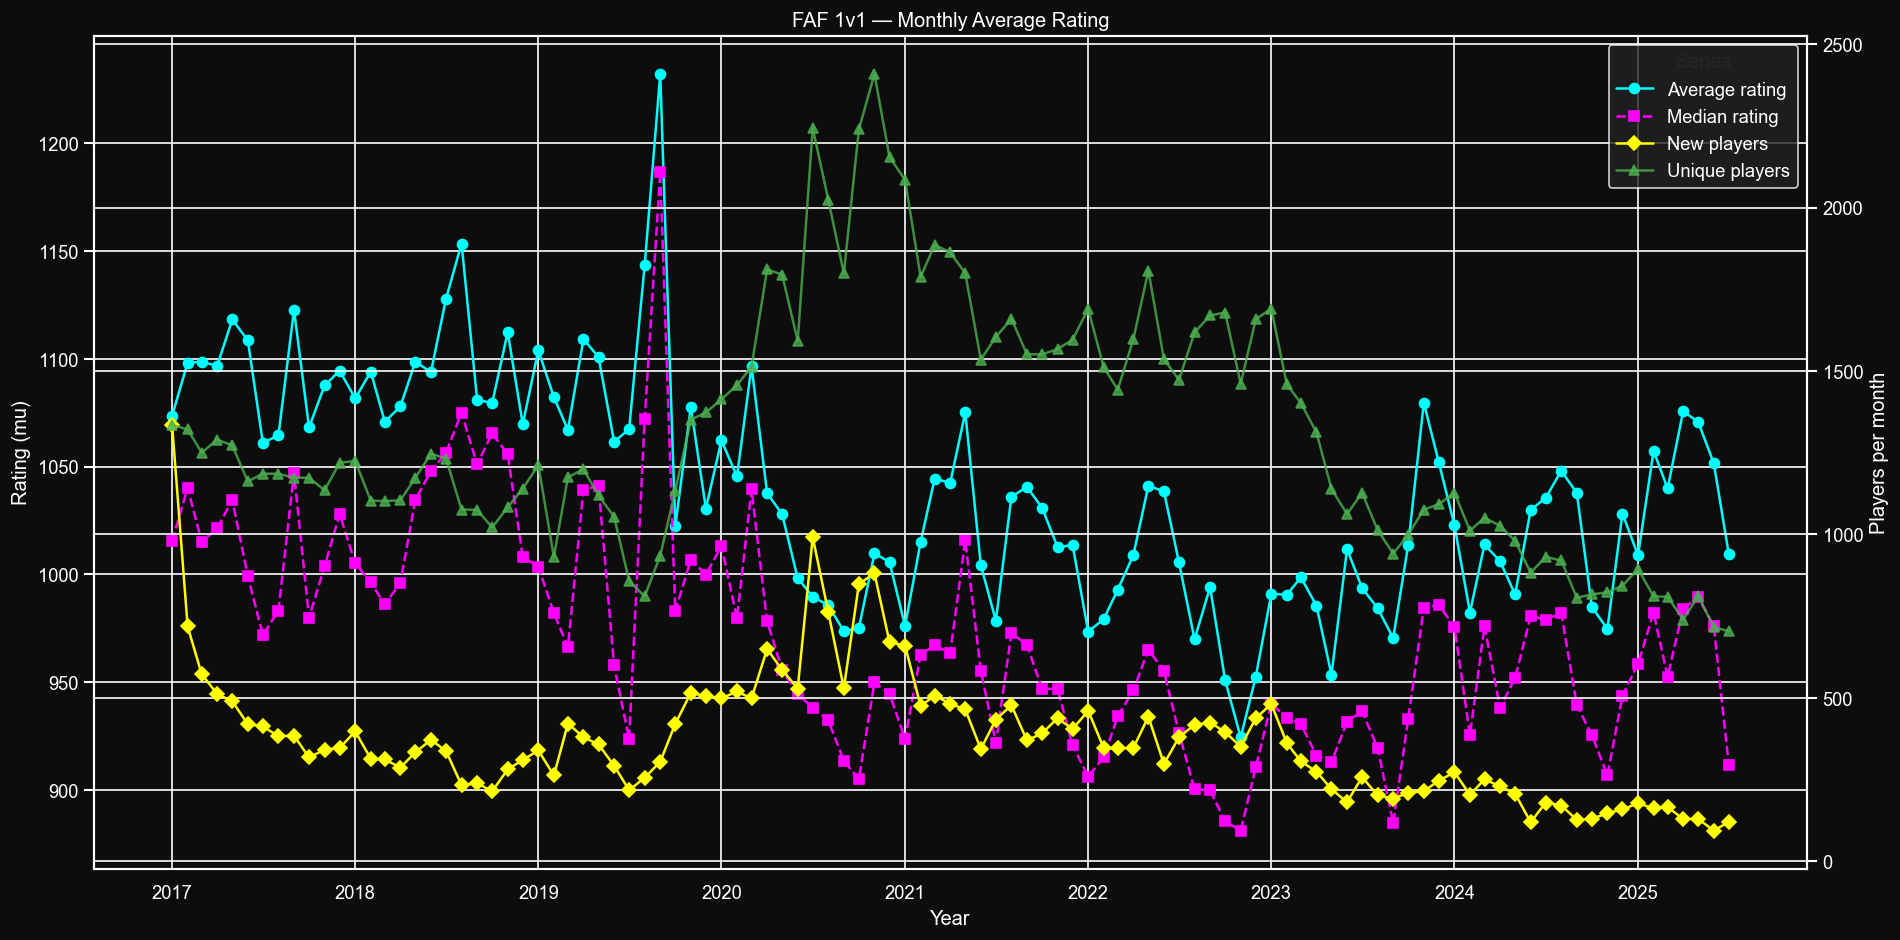
Average/median rating and new/unique players
Arrival of new players drives both average and median games rating down. The lack of new players does the opposite, since skilled players are more likely to remain. There is no other observable factor to rating "inflation" or "deflation".
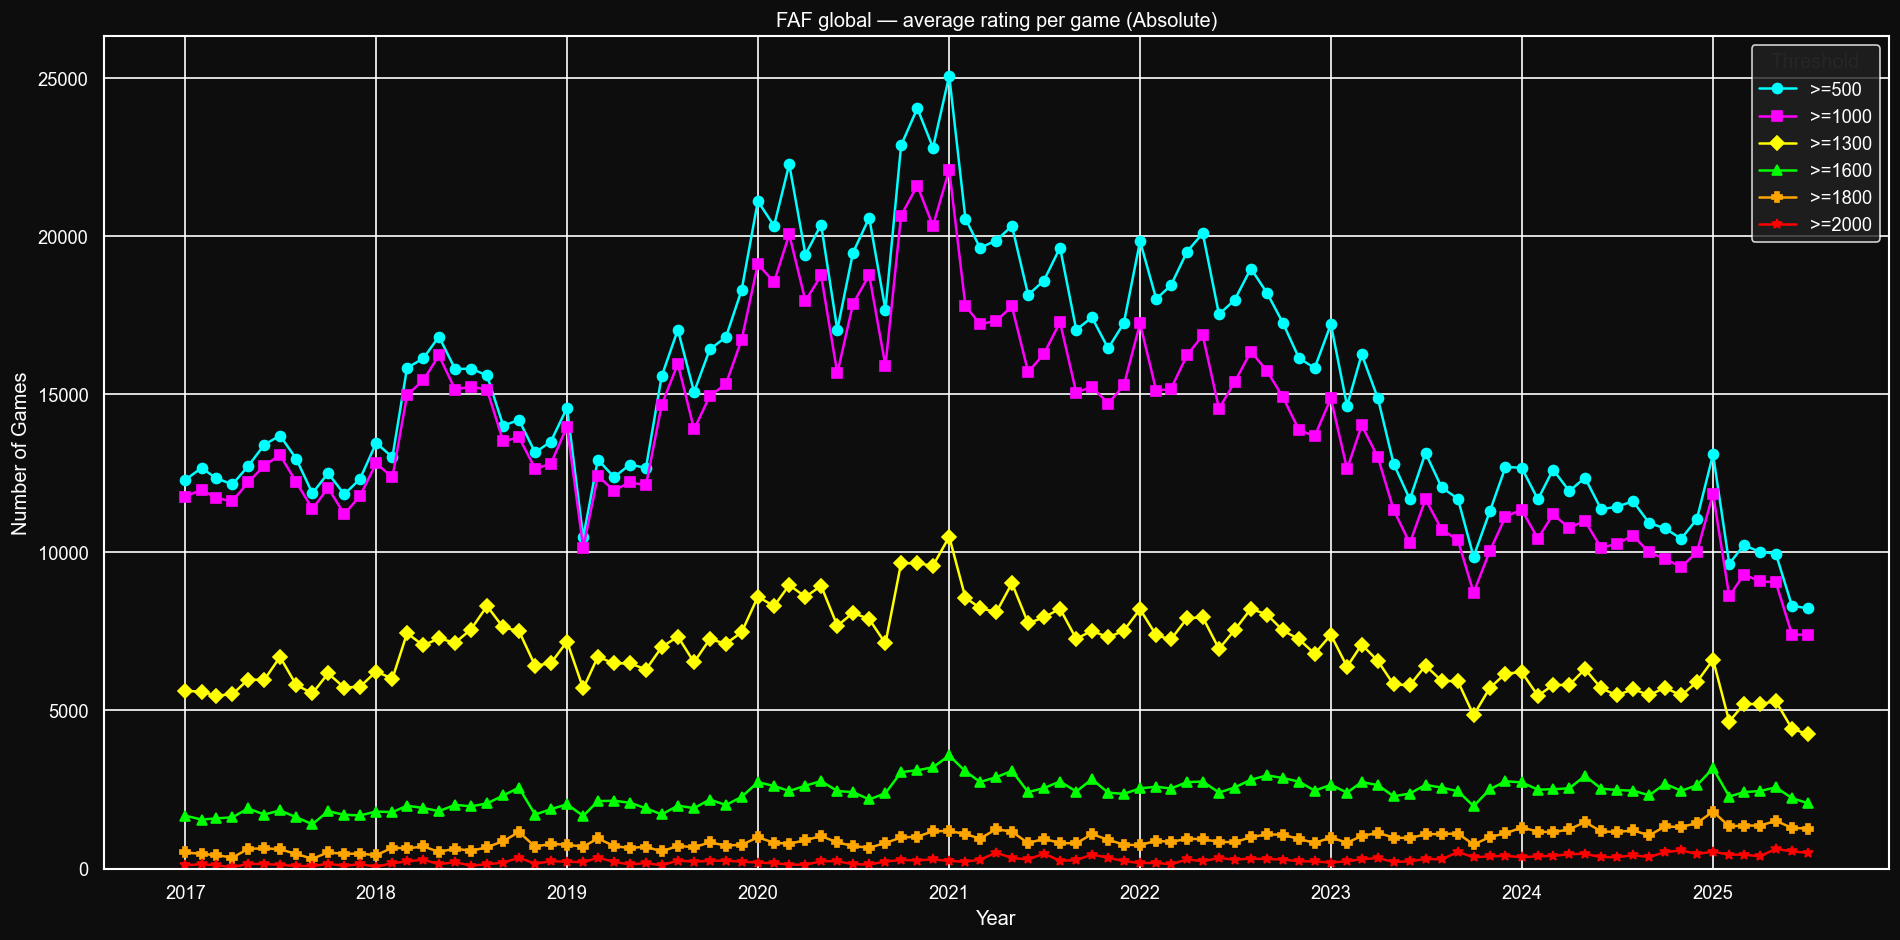
Number of avg rated games
In global almost every game with an average rating higher than 500 is also higher than 1000. In 2017-2020 they were almost perfectly matched. Today they are a bit more spread apart, but still surprisingly close.
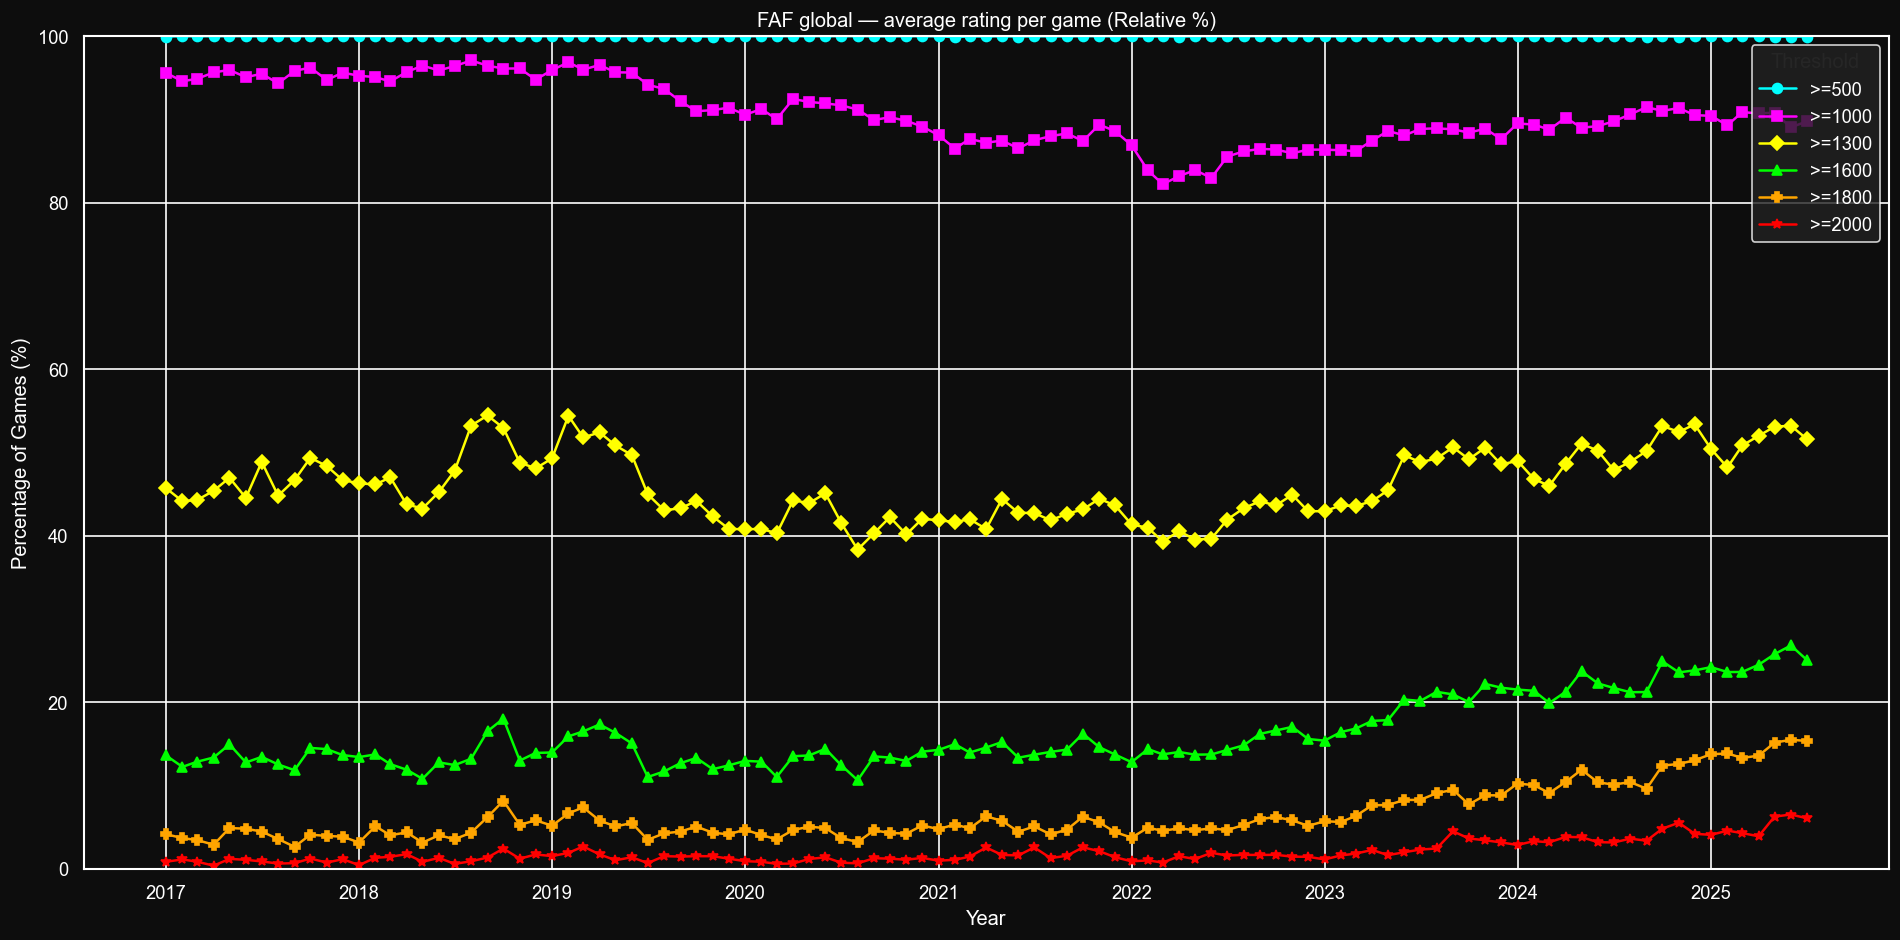
Average games rating, percentage
Ladder
Players and ratings
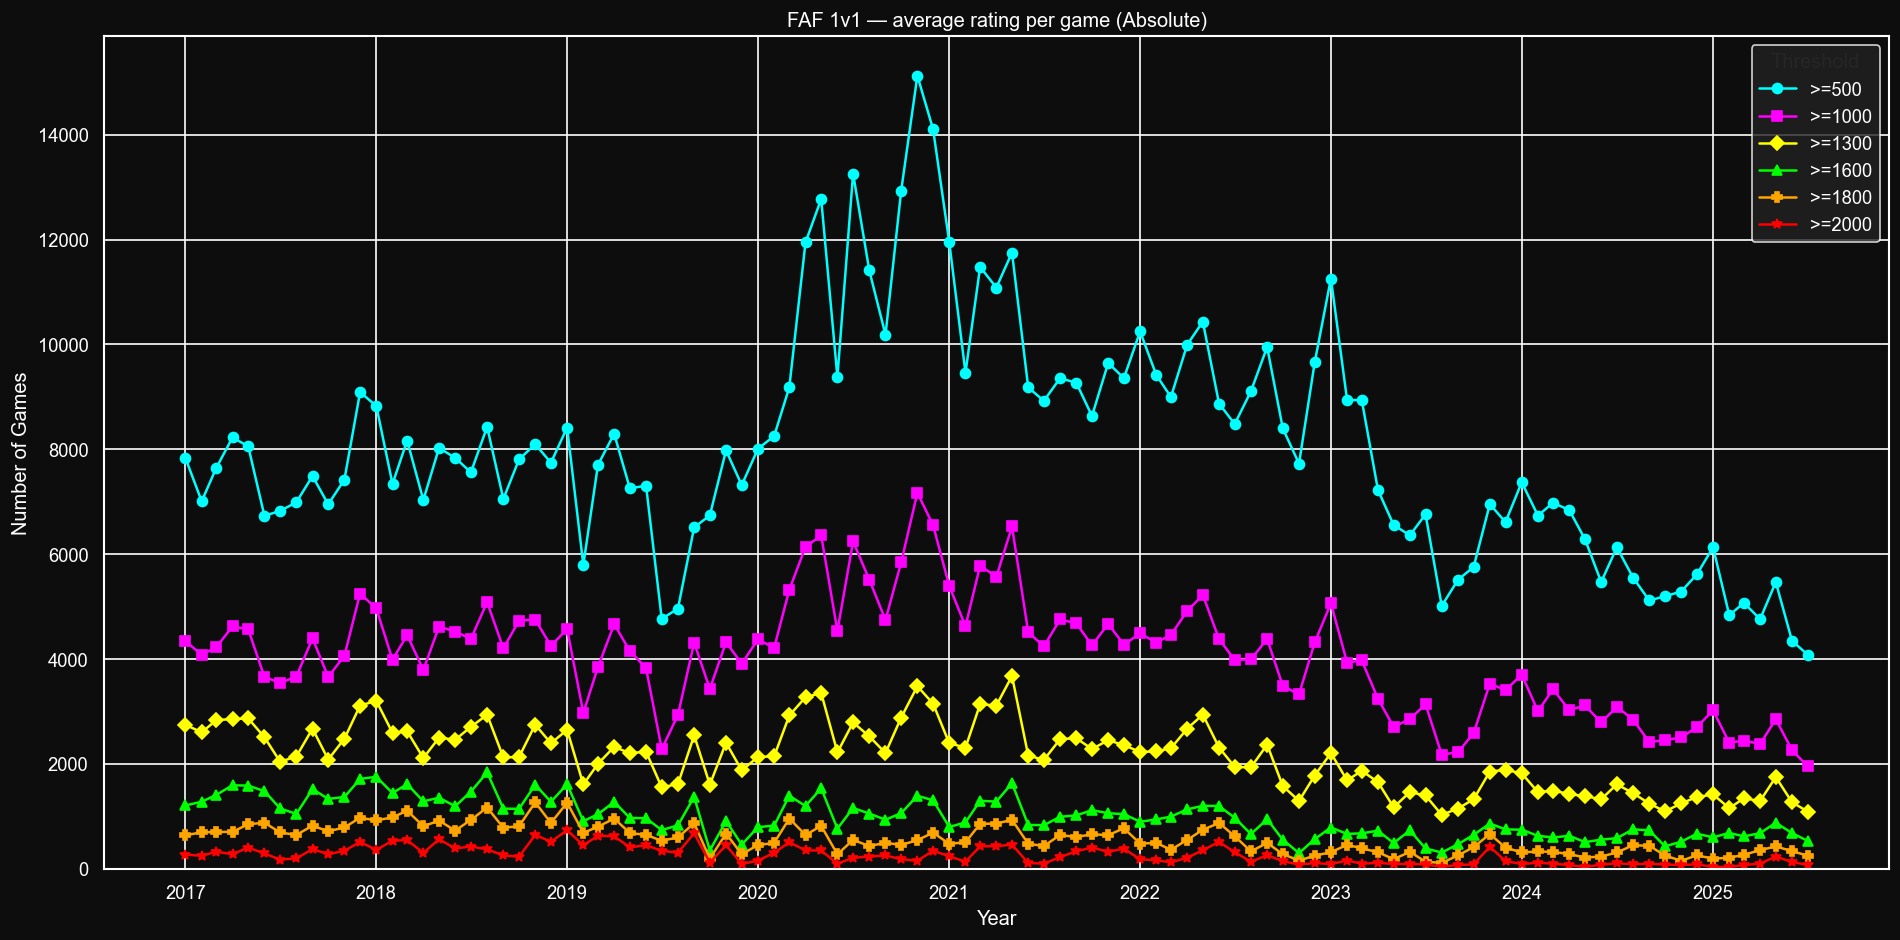
Number of avg rated games
Ladder is the only league with a significant amount of games with average rating less than 500. The share of games with average rating between 500 and 1000 is ladder is also much higher than in global, where 500-1000s players are much more likely to get teamed up with 1500+ in some big lobby. As a consequence, in ladder both median and average are around 300-400 points smaller compared to global.
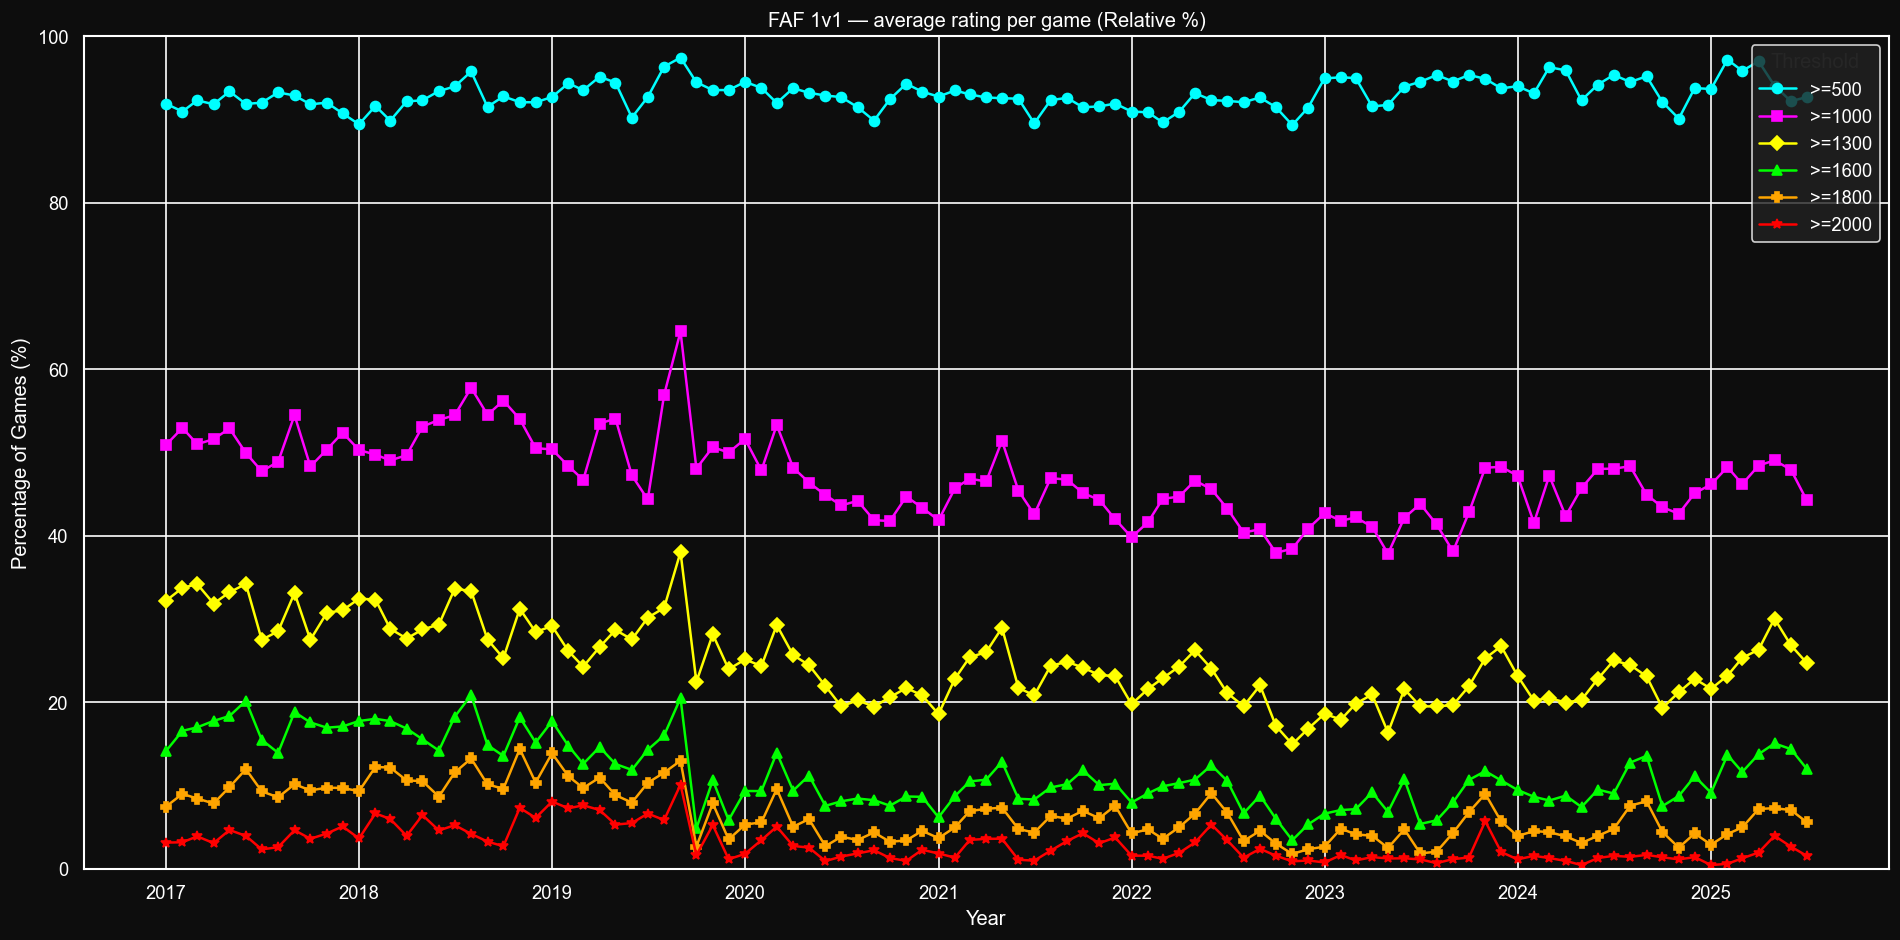
Average games rating, percentage
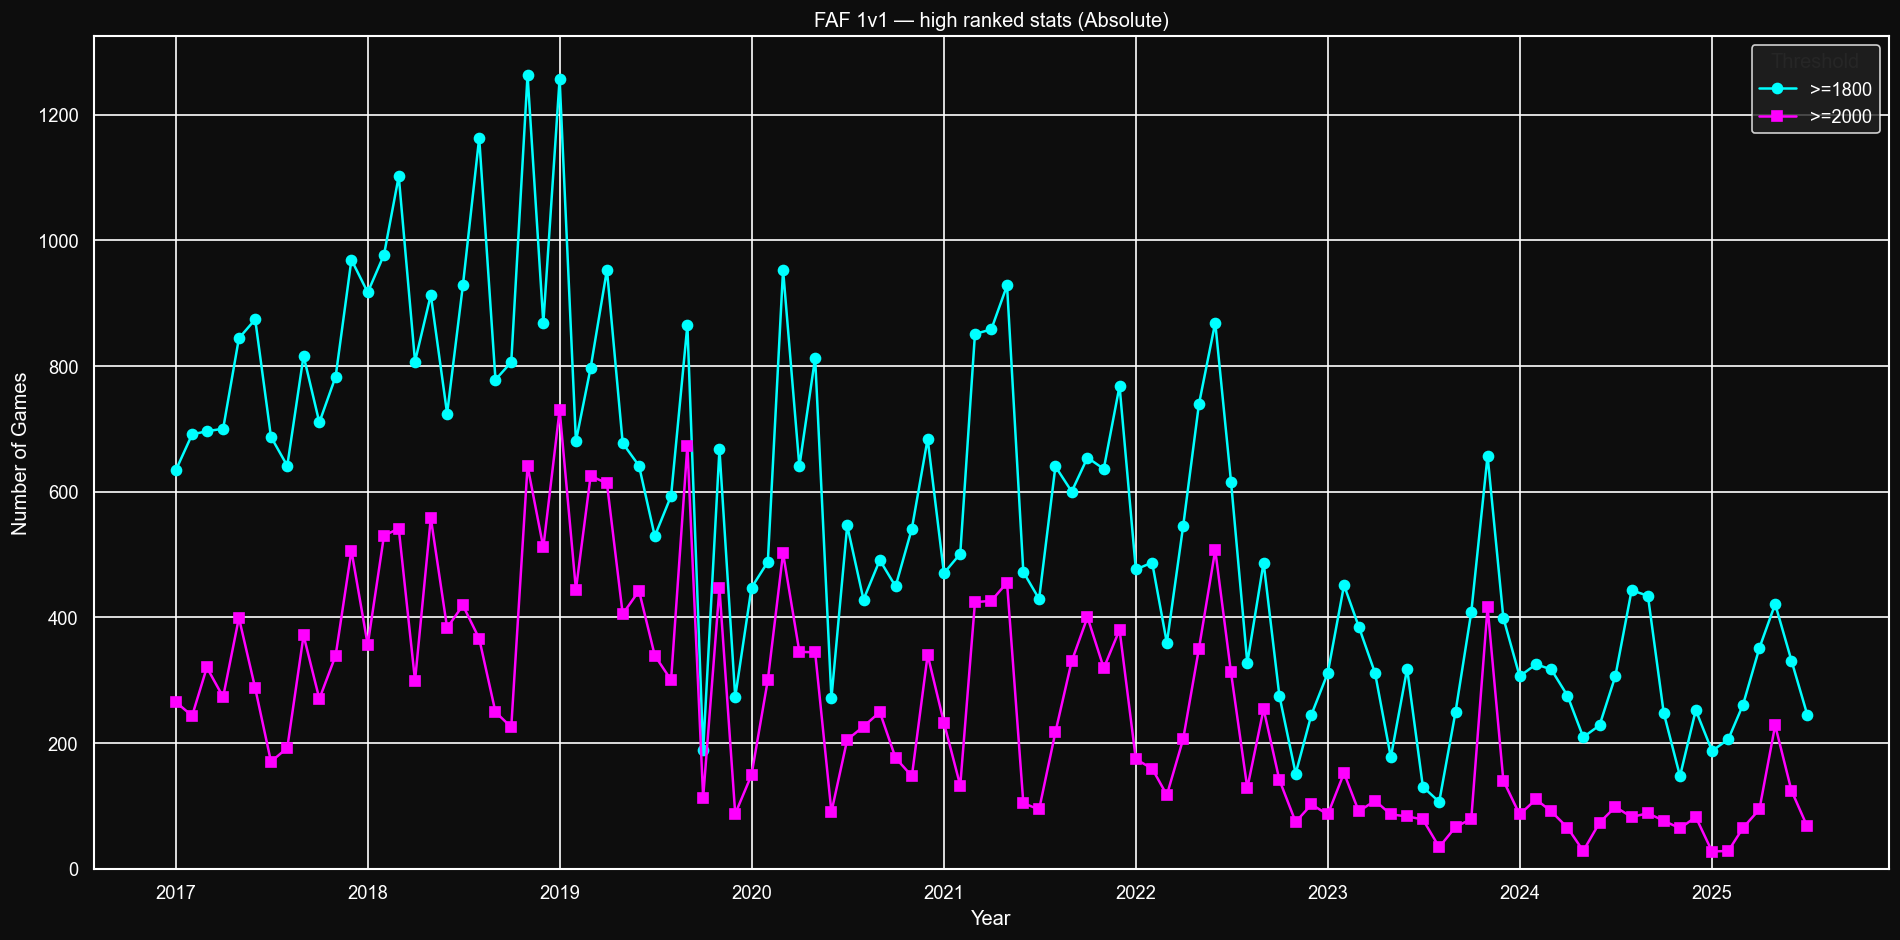
Top ladder
Amount of ladder games with an average rating above 1800 has peaked at over 1000 games per month at the end of 2018-beginning 2019 and decreased ever since. It did not benefit from the increased player activity during the pandemic.
Number of avg rated games
Share of games
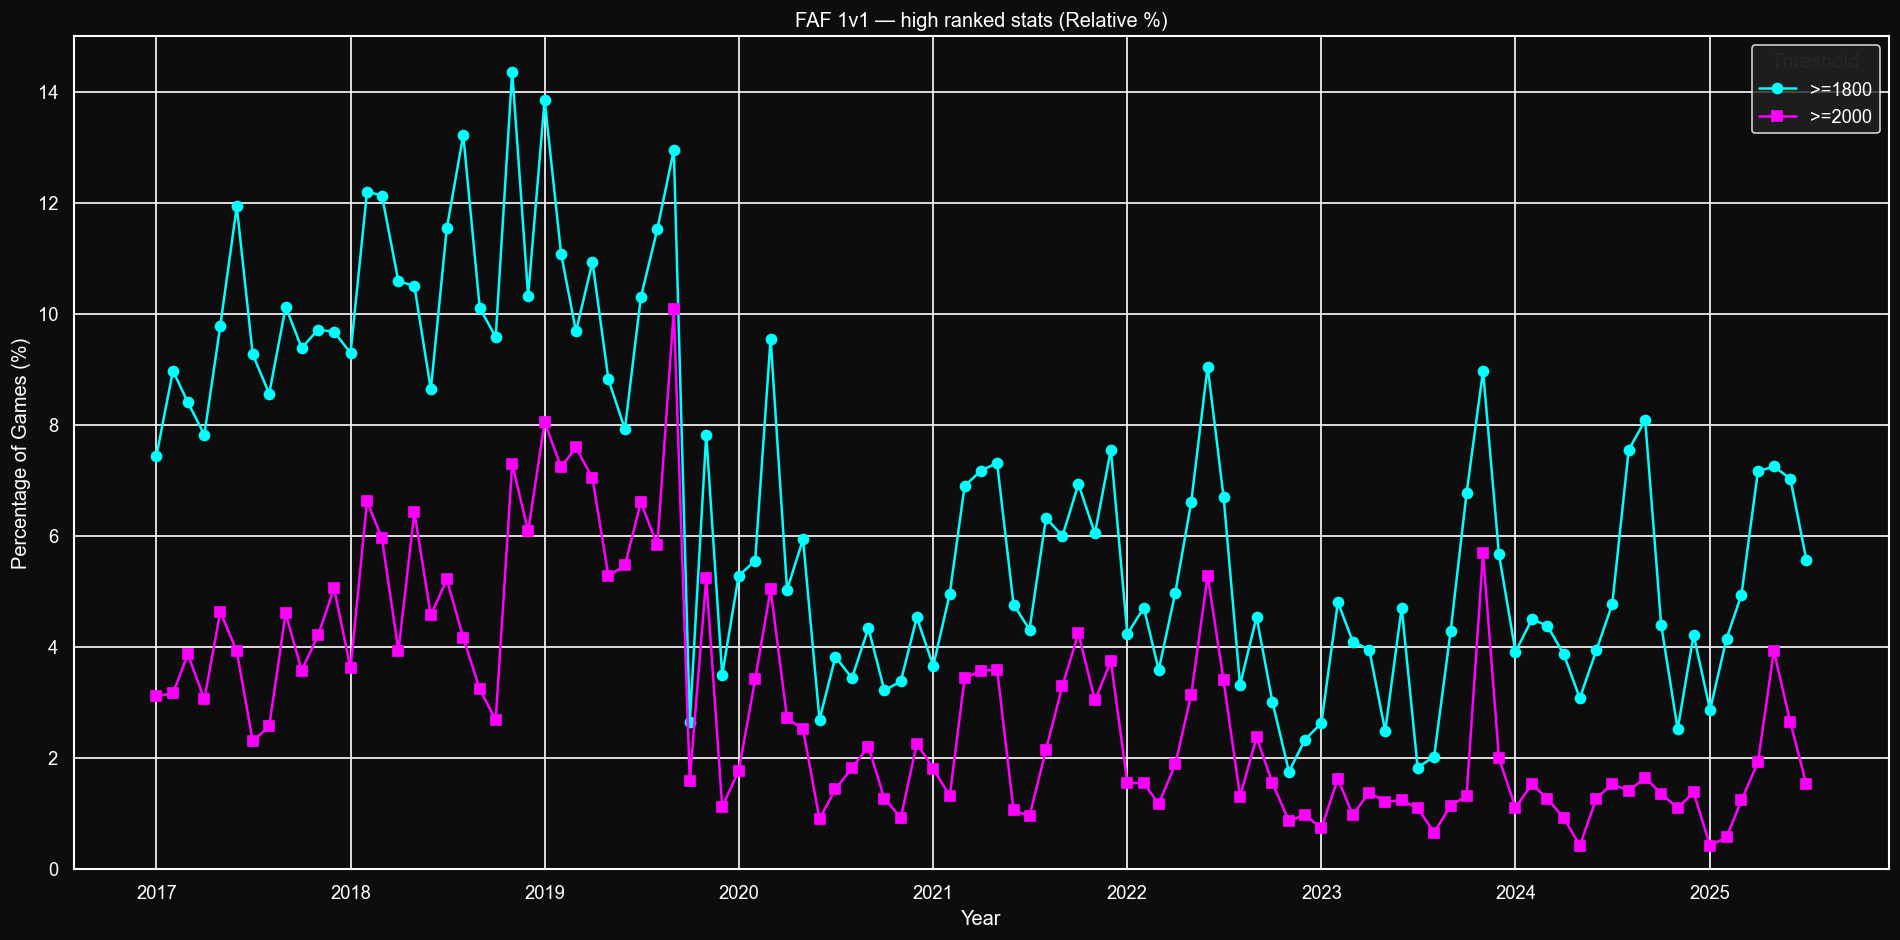
Table
Here only Januaries of every year are compared, not every month or every year. With the overall decrease in games the ratio of >=1800 to >=2000 games increases, as two 2k players are becoming more likely to be matched against sub-2k player during the overall shortage of activity.
Year, month >= 1800 >= 2000 Ratio 2017-01 634 265 2.39 2018-01 917 356 2.58 2019-01 1257 730 1.72 2020-01 447 149 3.00 2021-01 470 232 2.03 2022-01 476 174 2.74 2023-01 311 86 3.62 2024-01 306 86 3.56 2025-01 187 27 6.93 2v2 TMM
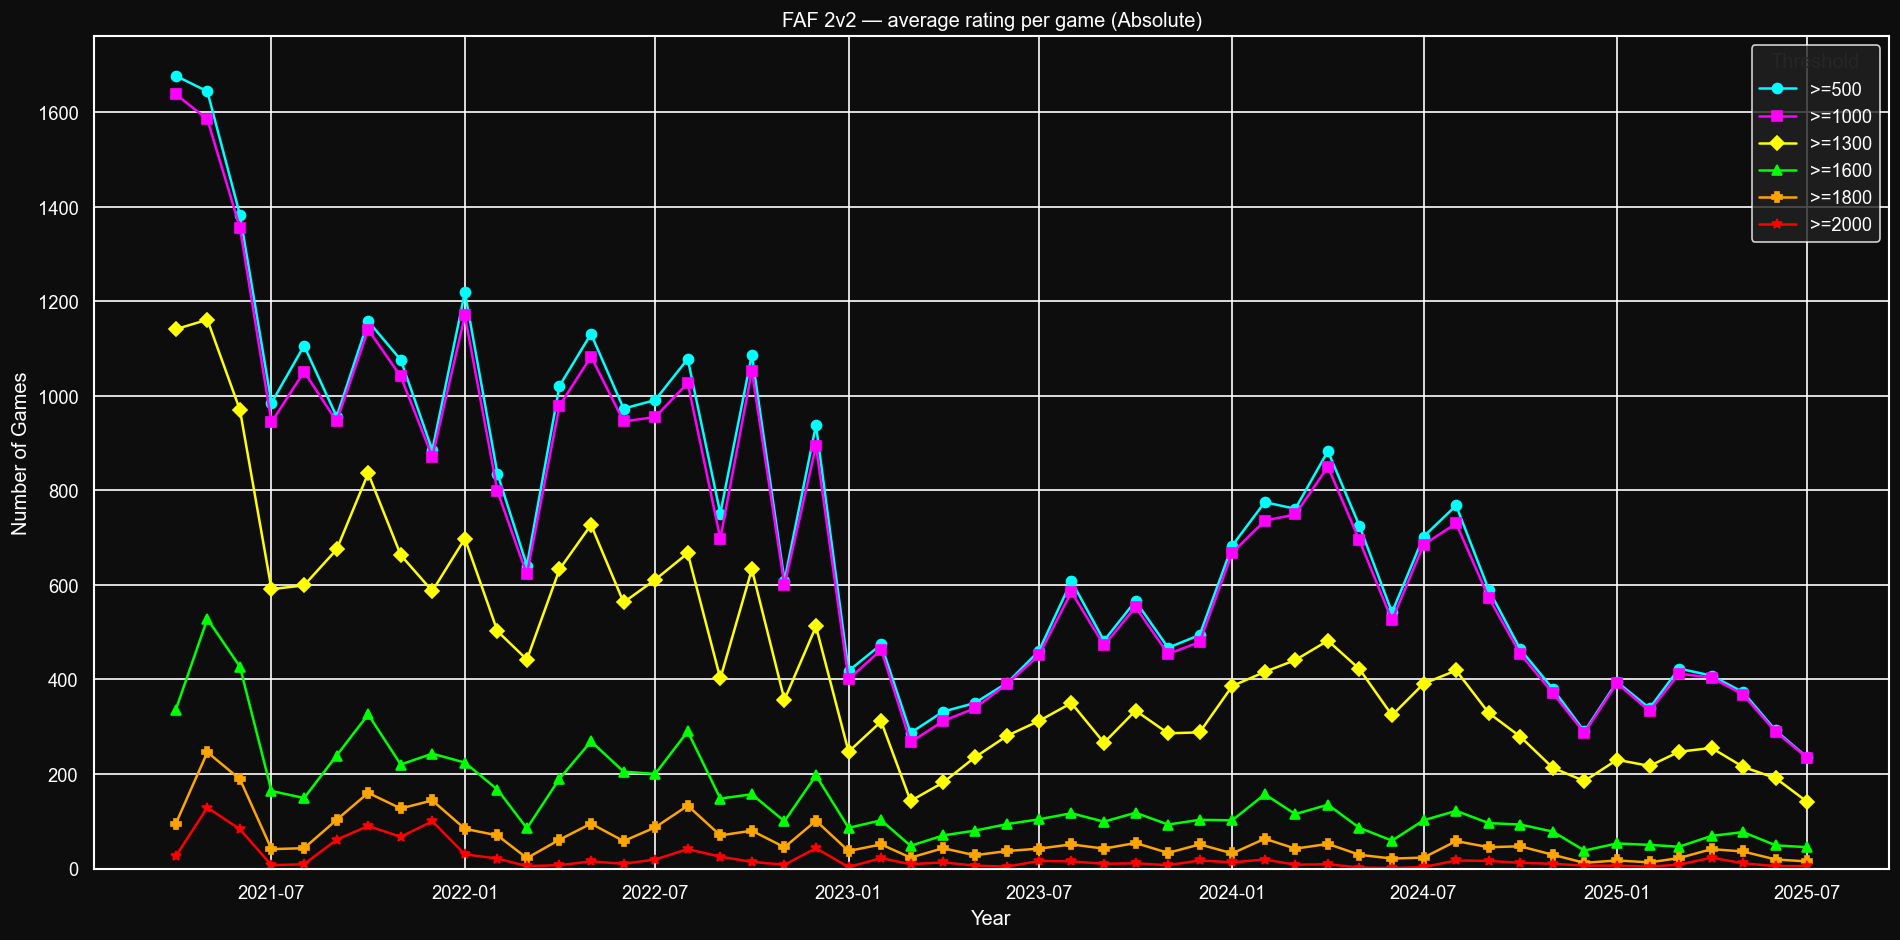
Players and ratings
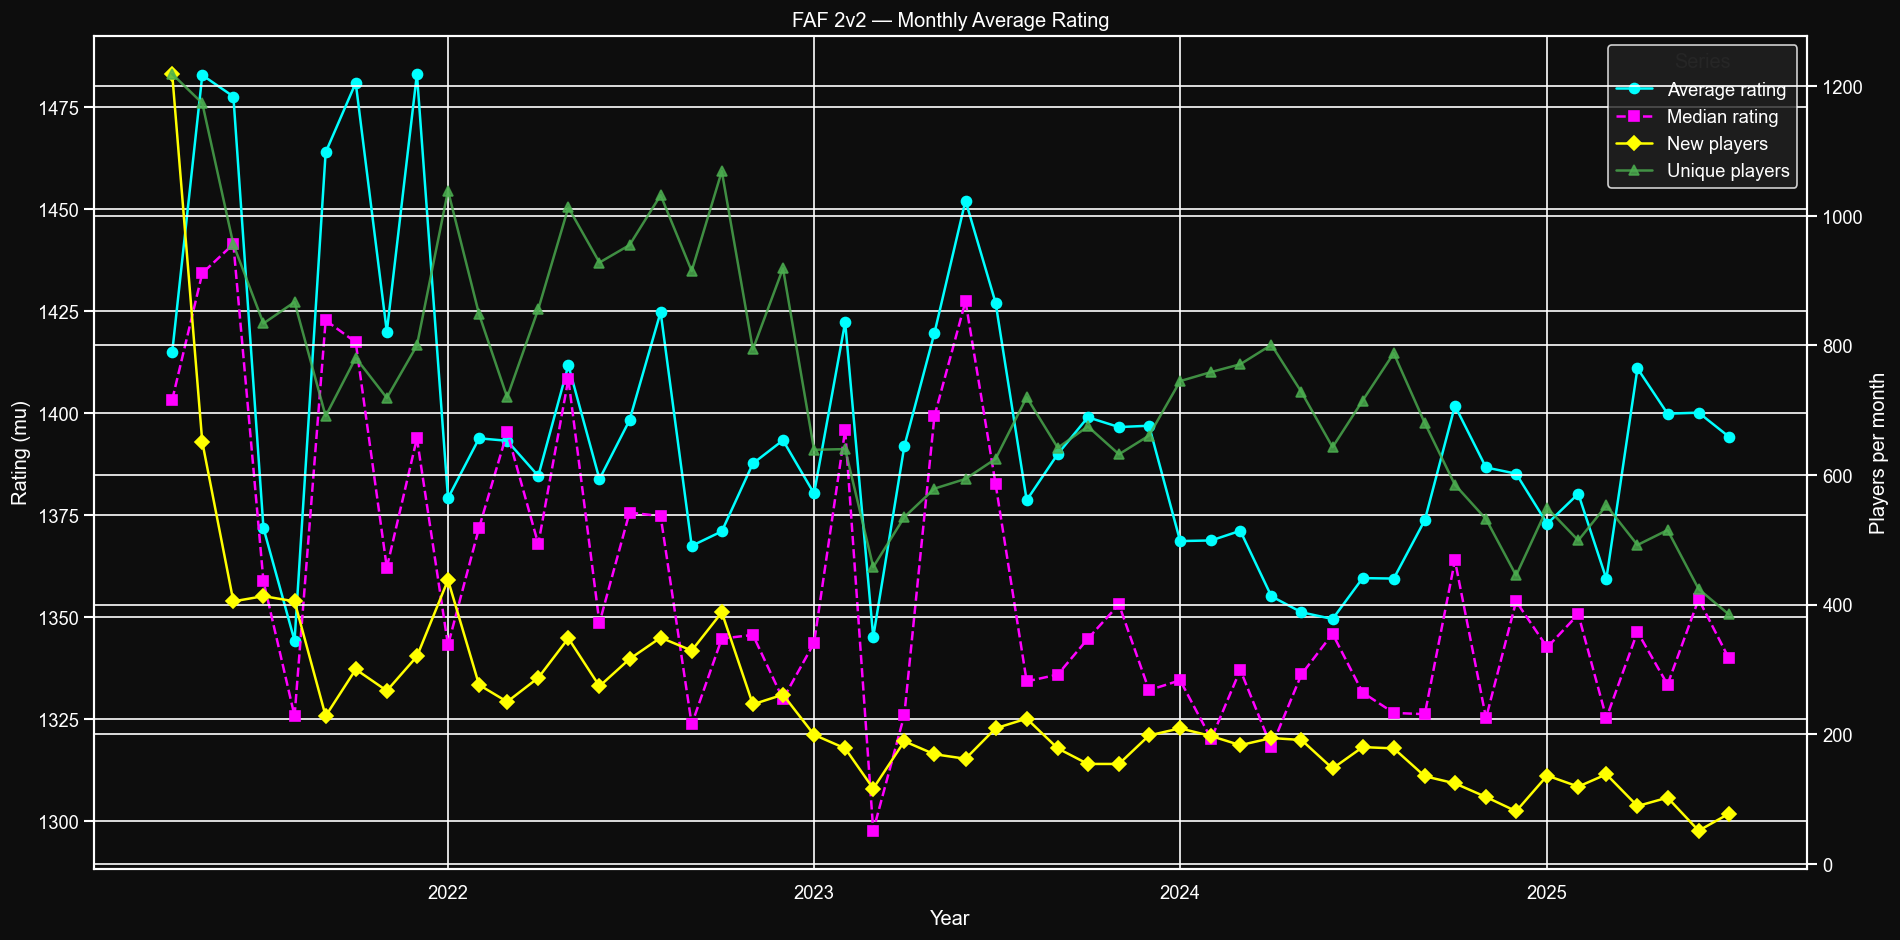
Number of avg rated games
In 2v2 surprisingly share of 500-1000s games is even less than in global. There is also virtually no <500 games. Average and median are only slightly below global levels.
Average games rating, percentage
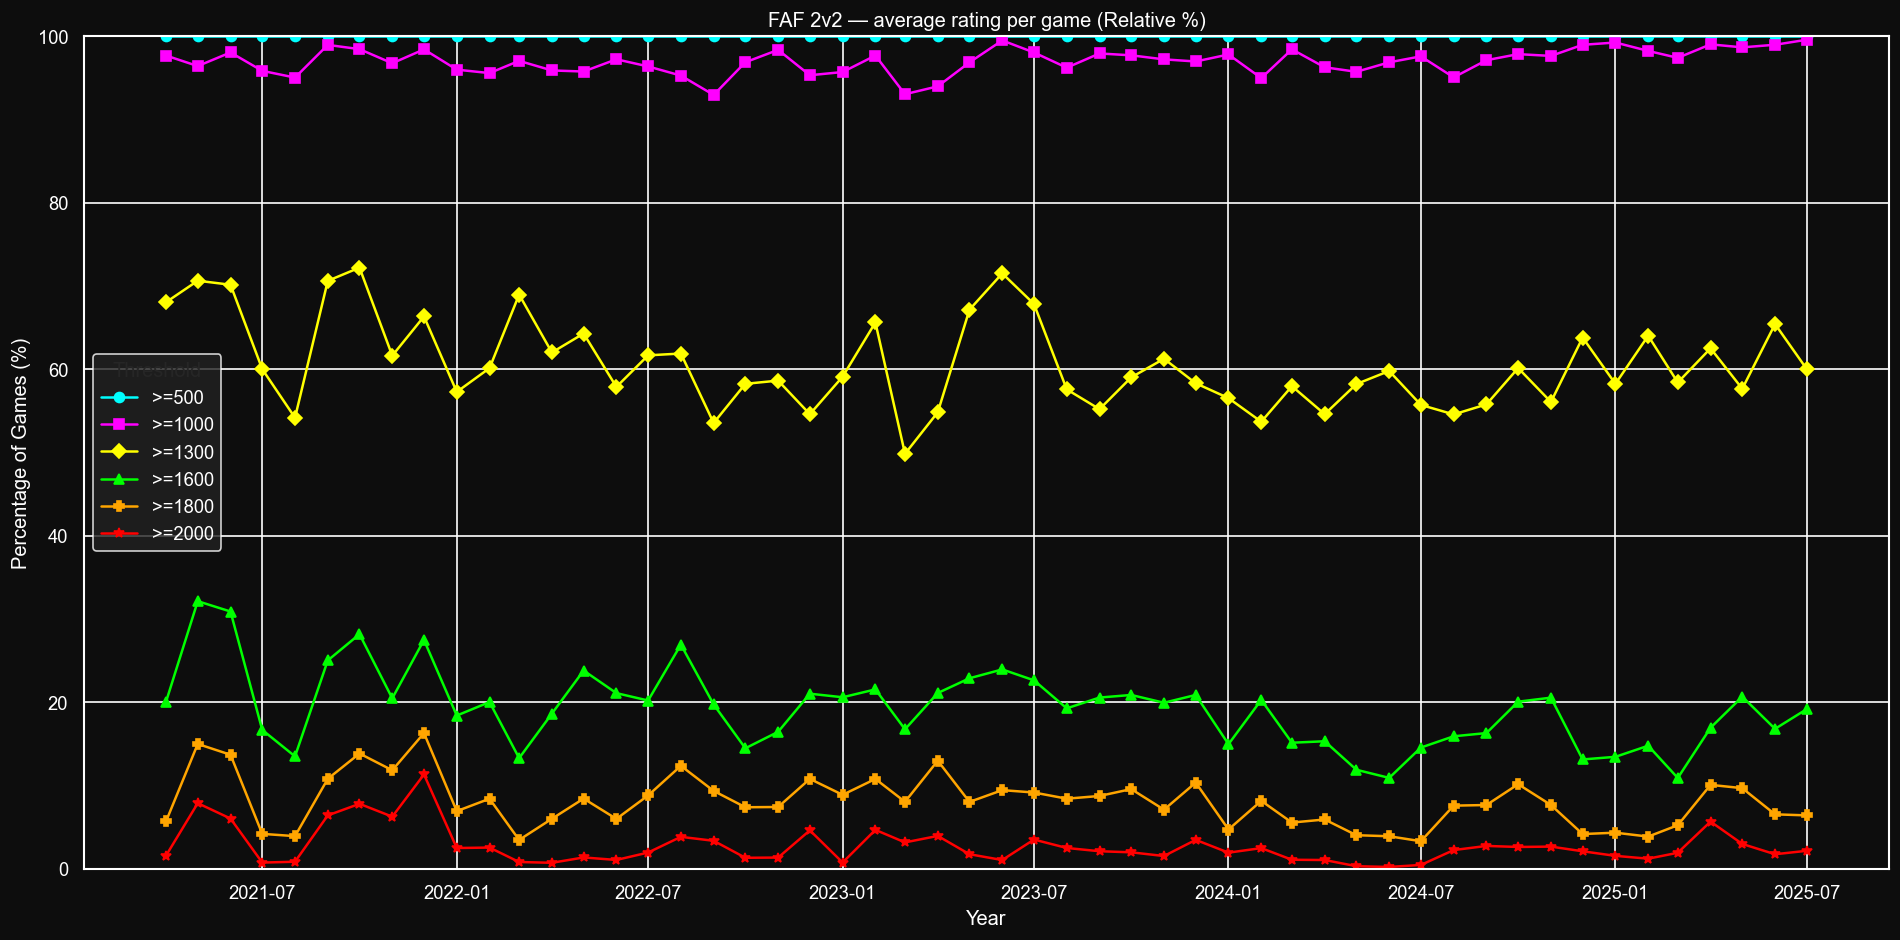
3v3 TMM
Players and ratings
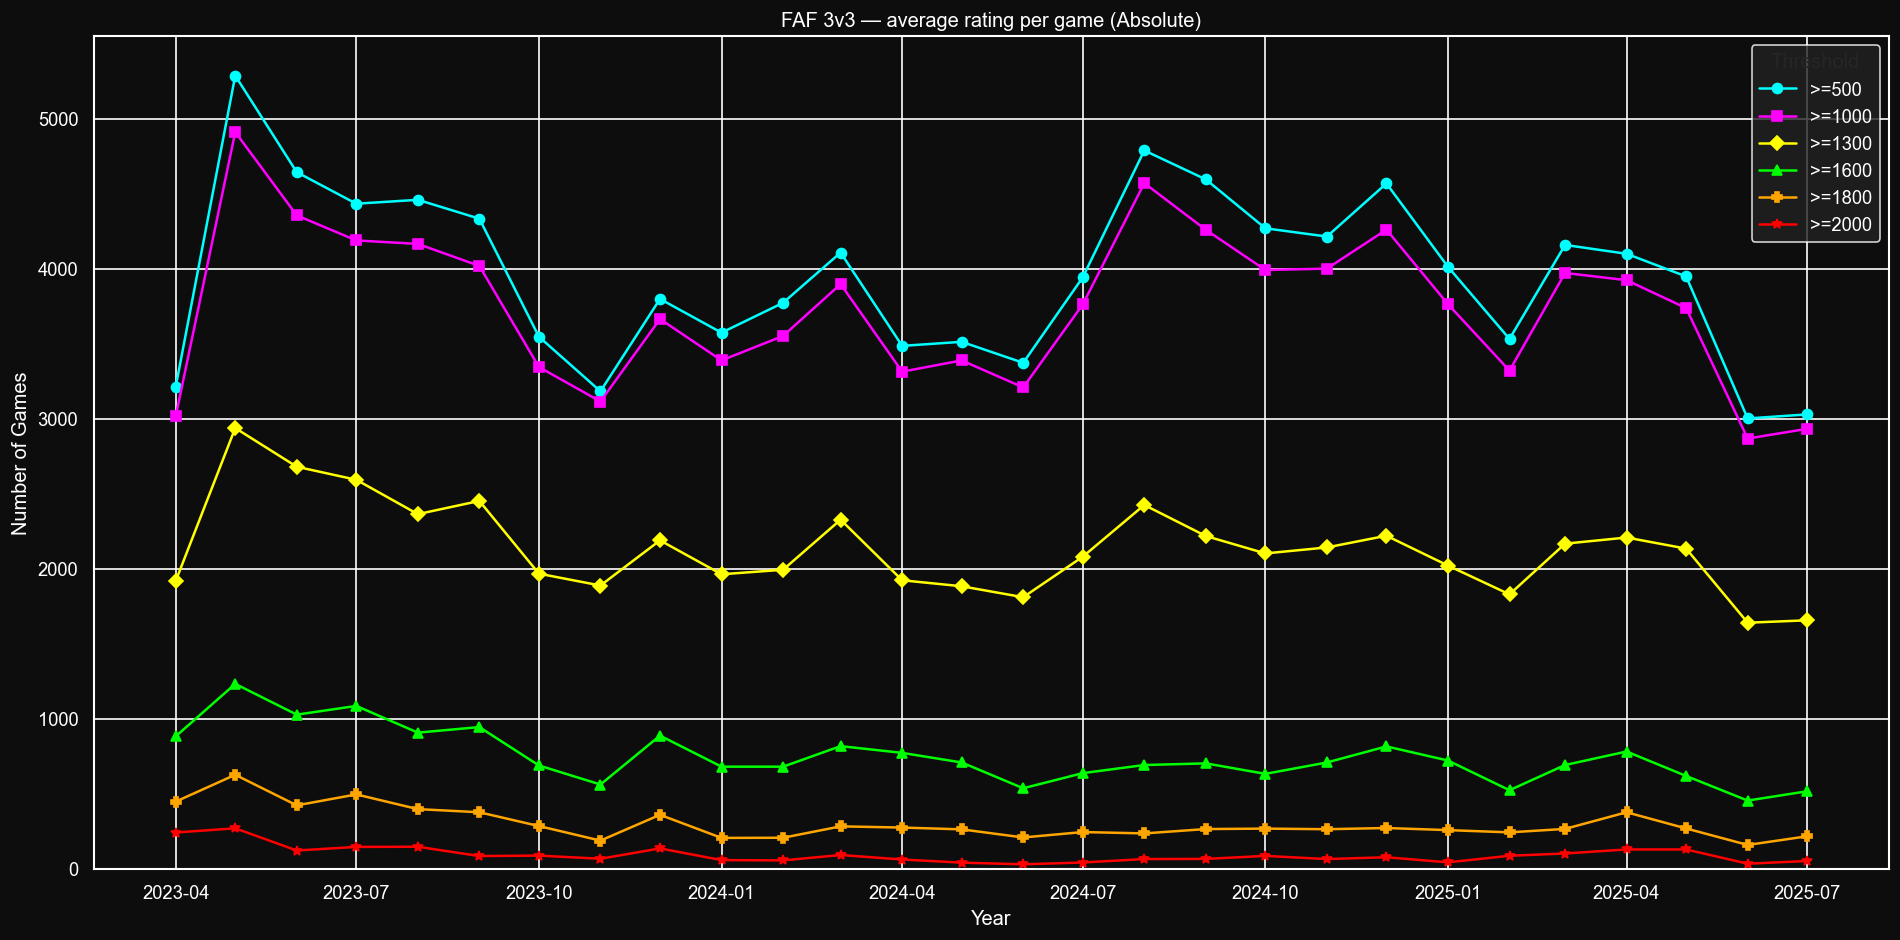
Number of avg rated games
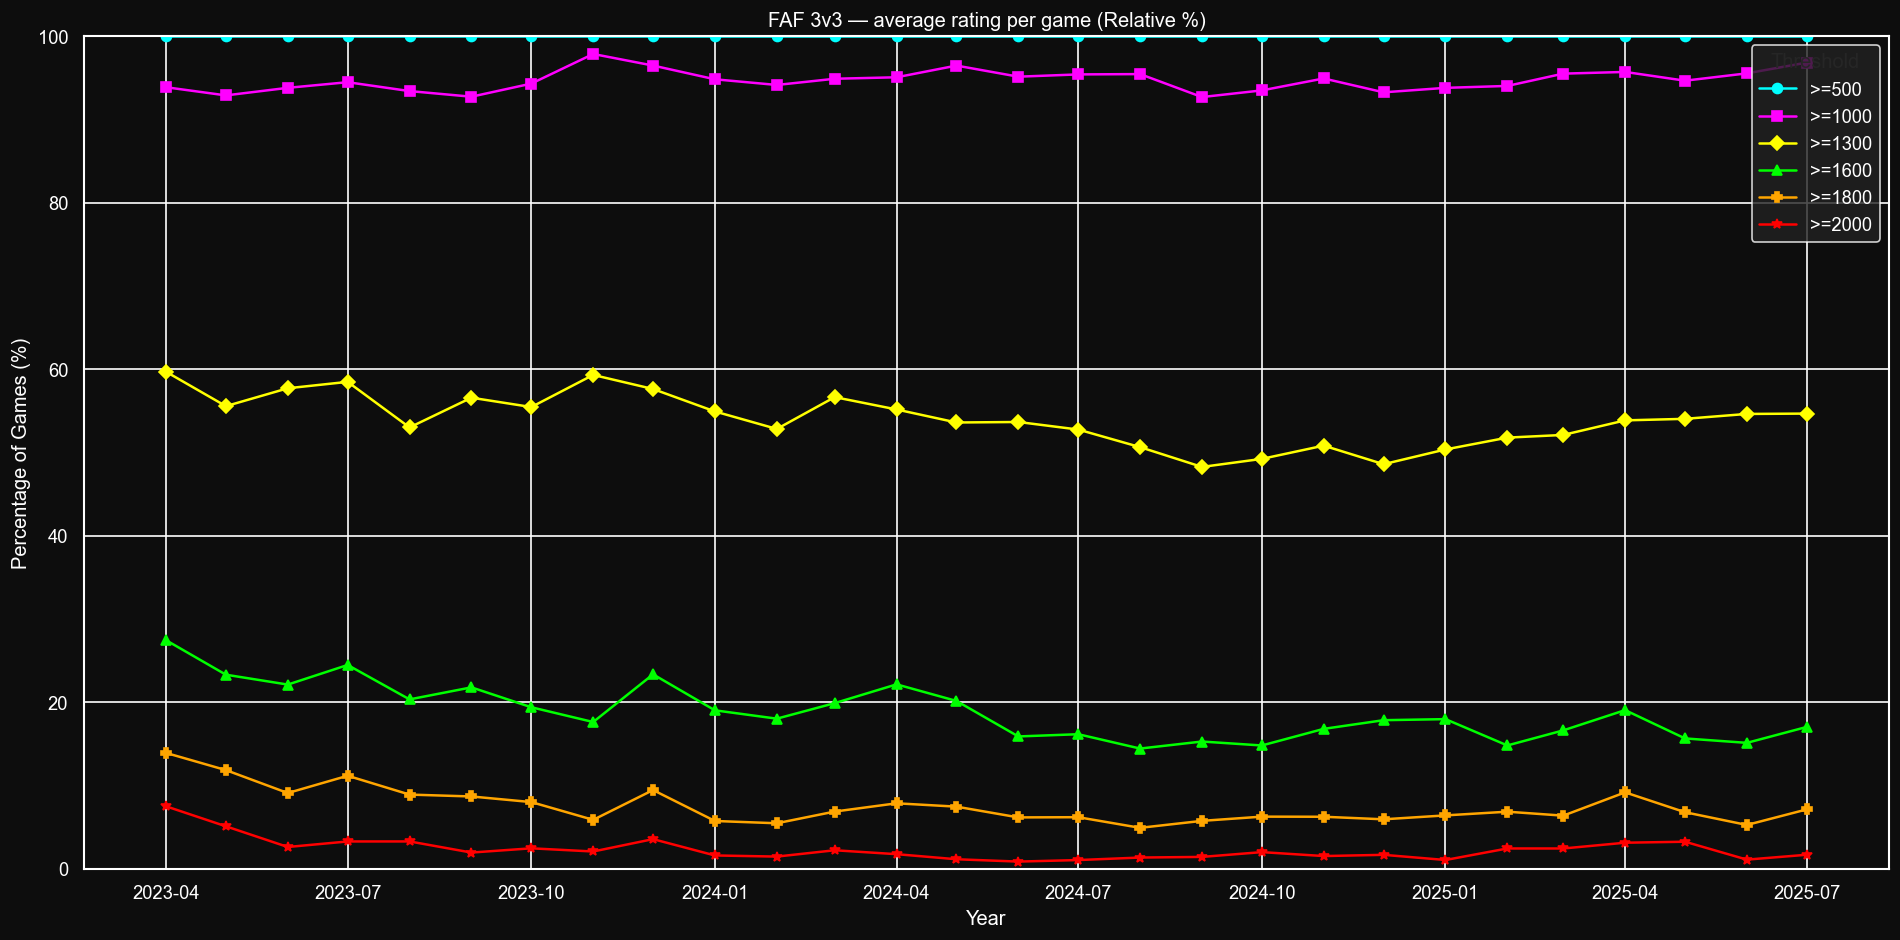
Average games rating, percentage
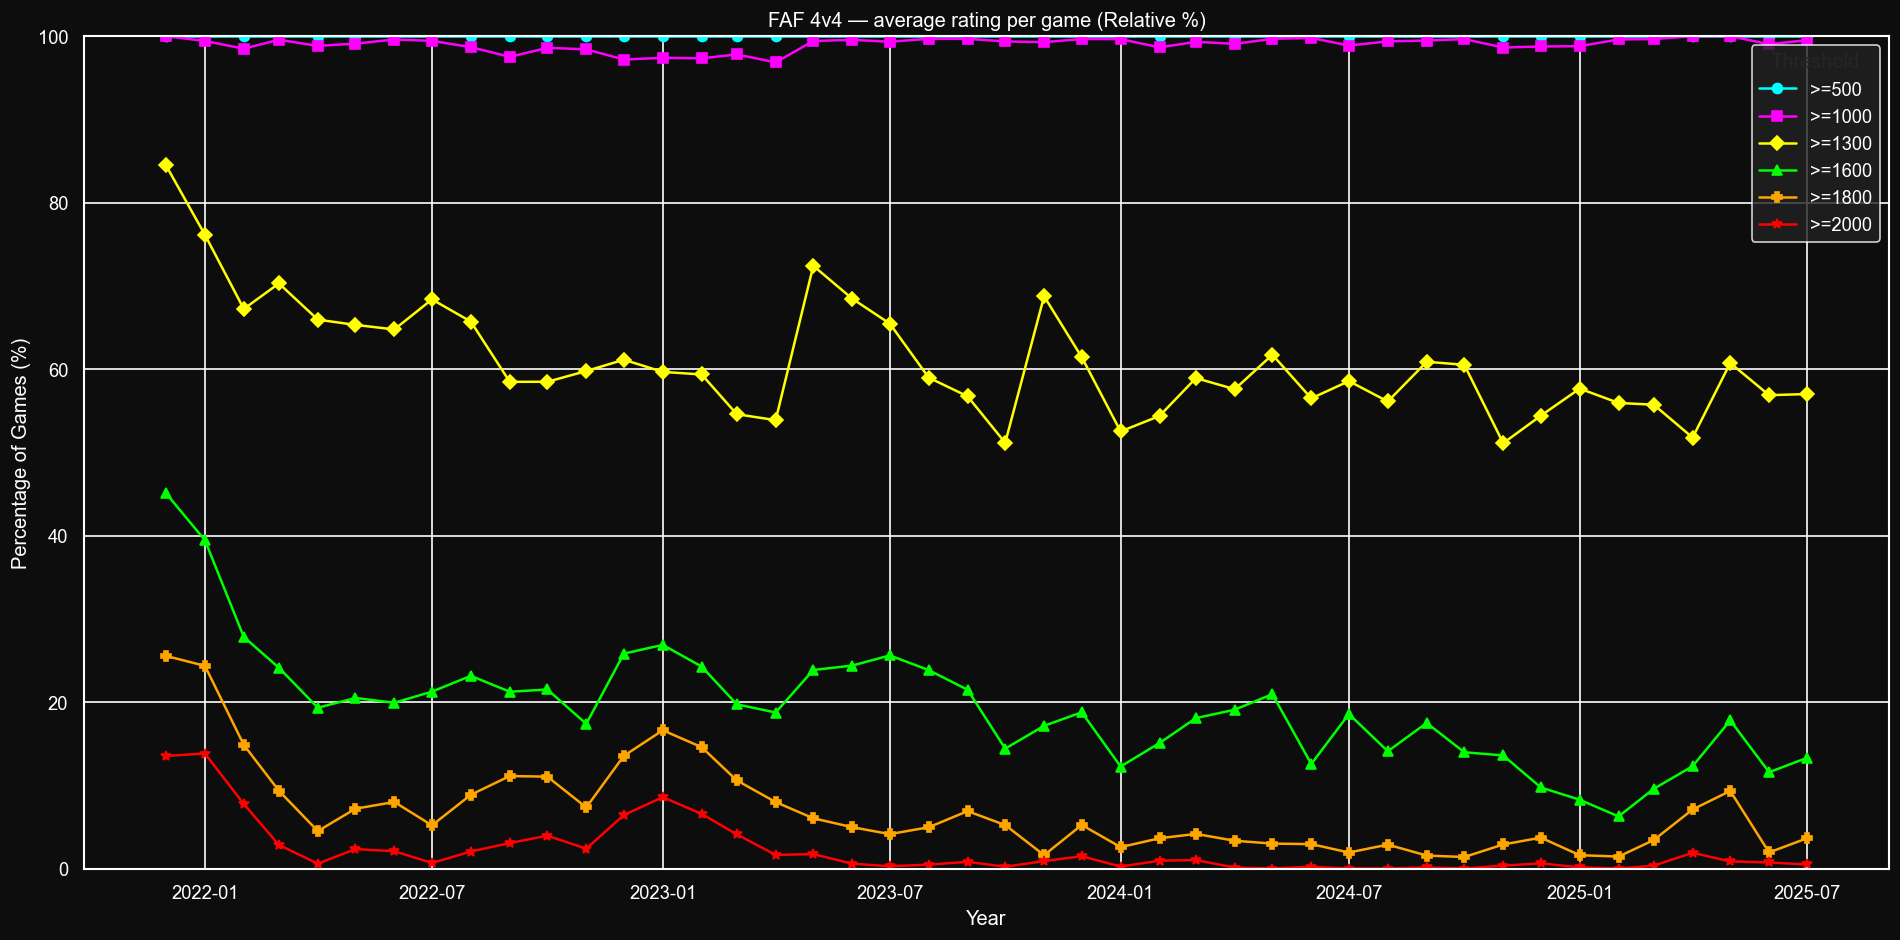
4v4 TMM
Players and ratings
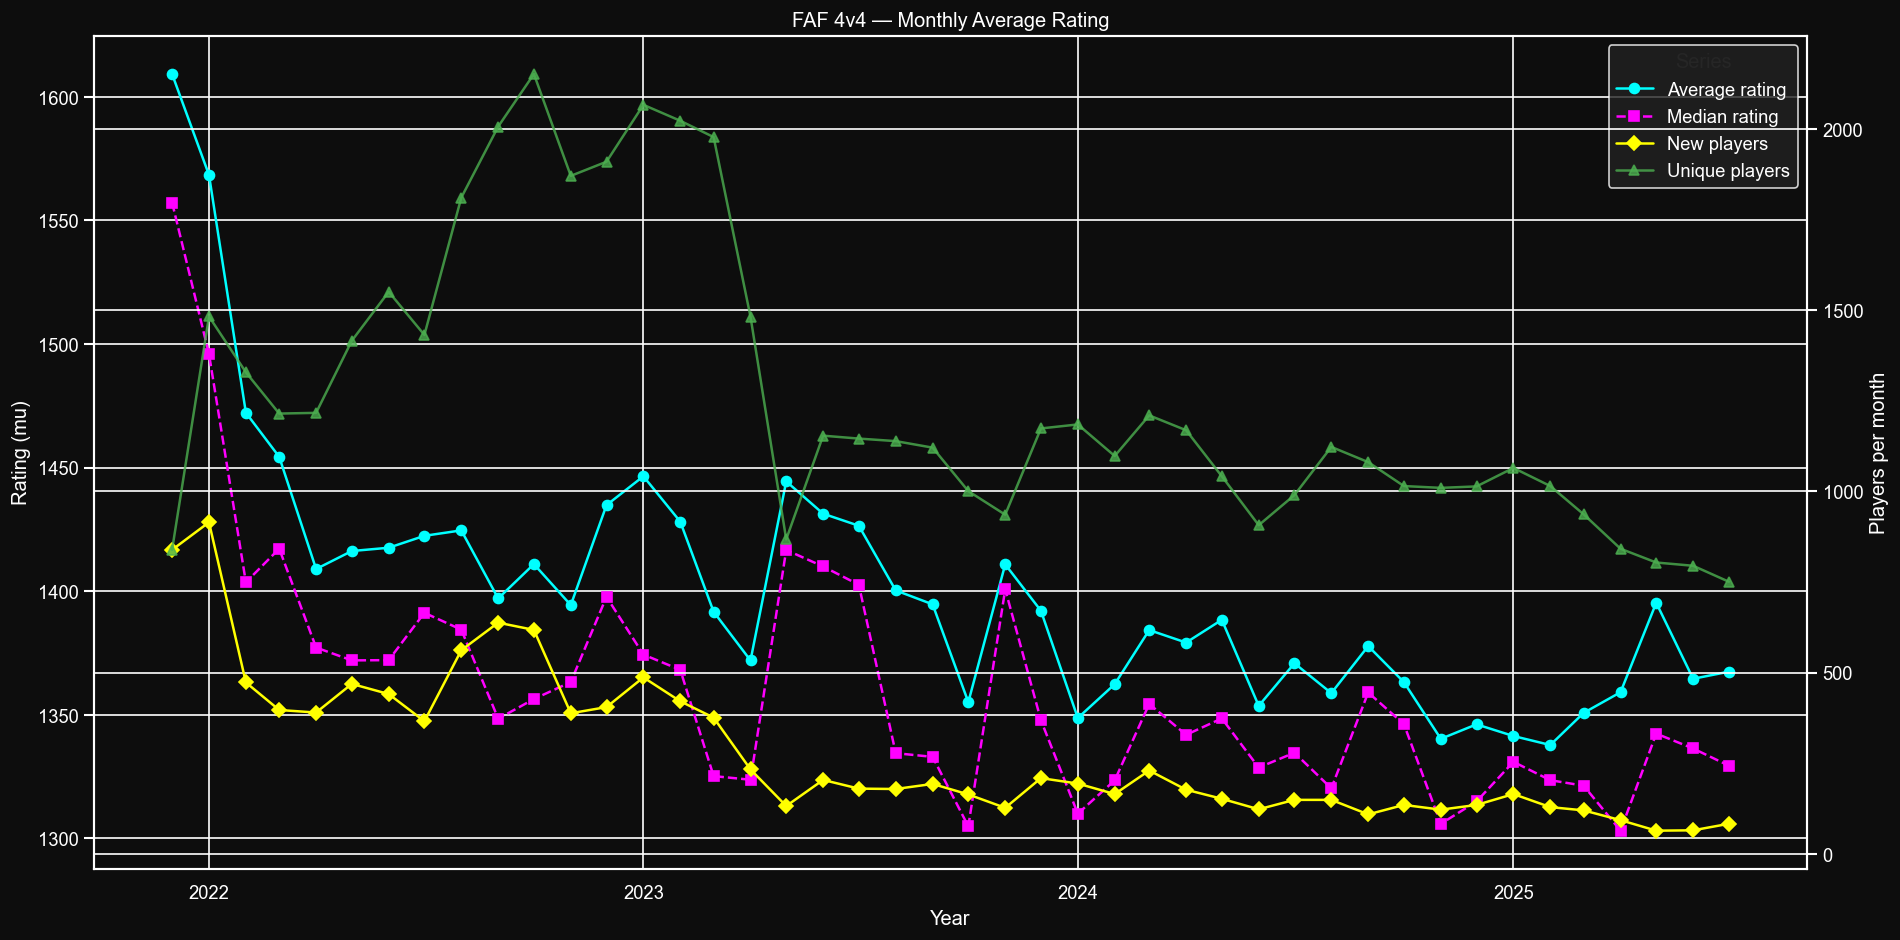
Number of avg rated games
With introduction of 3v3 the amount of 4v4 games has significantly decreased. Most people queue both for 3v3 and 4v4, and 3v3 inevitably fills faster than 4v4.
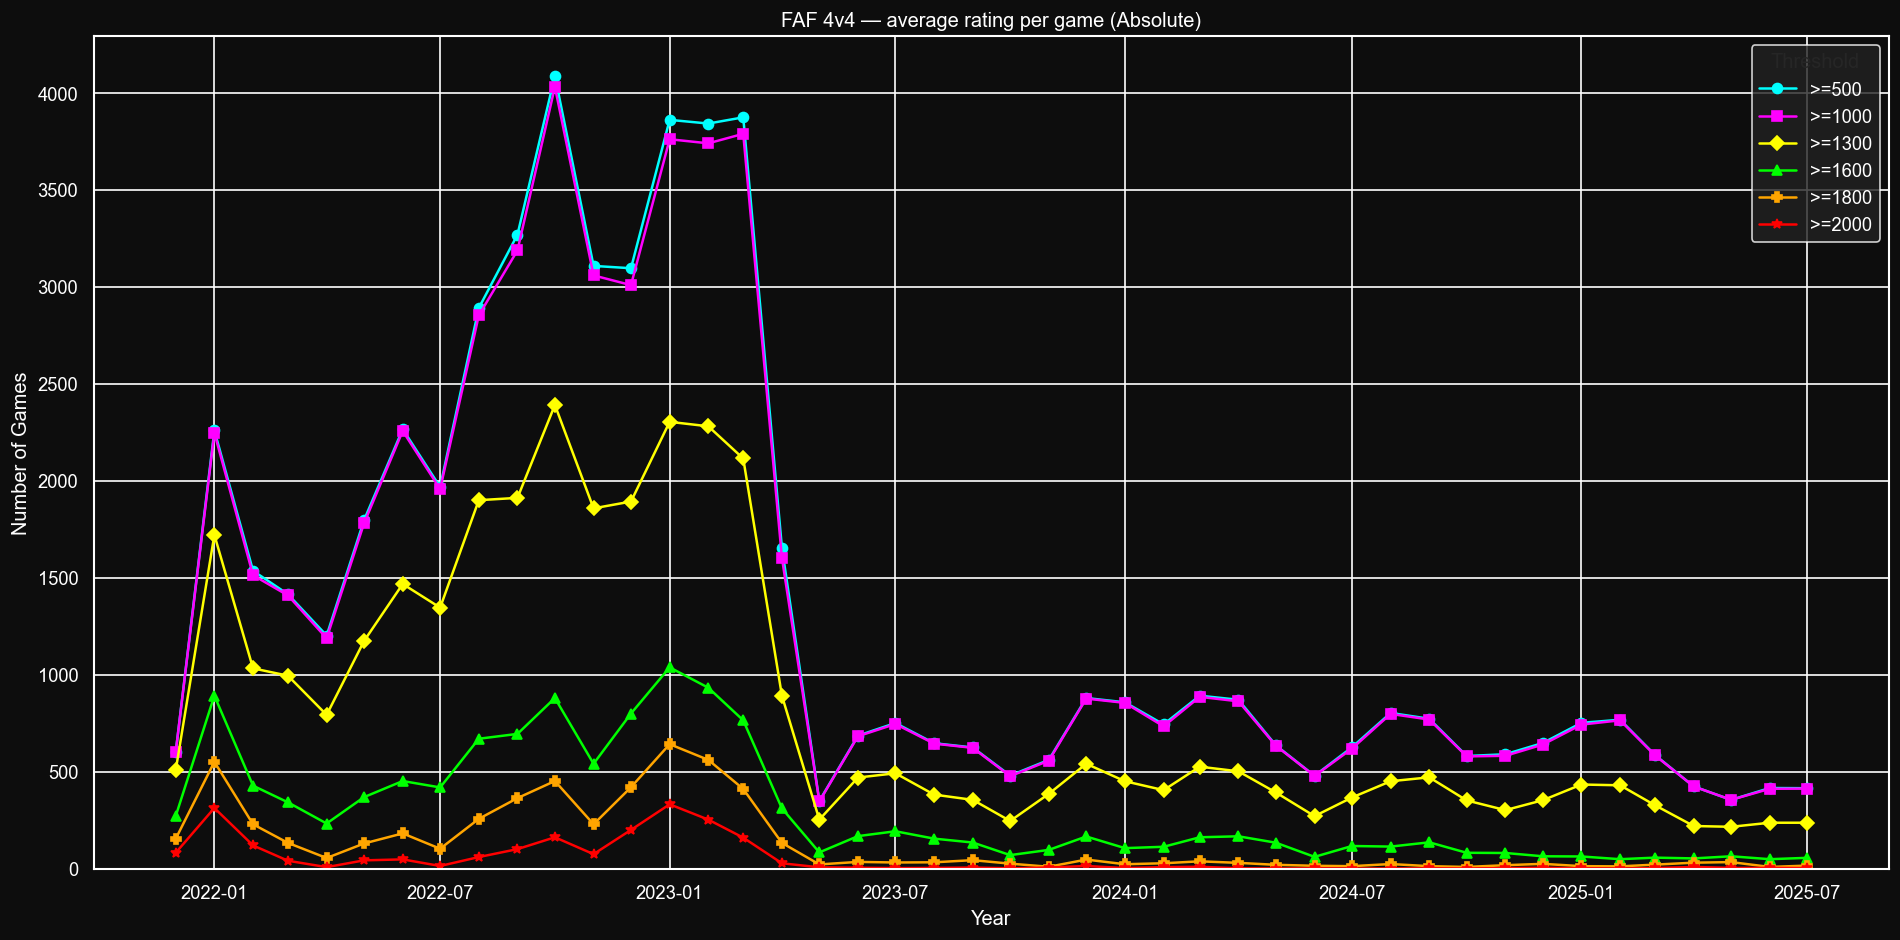
Average games rating, percentage
-
Nice, thanks for doing more stats. Glad the code I sent helped.
I think you posted the same graph twice under Leagues distribution.
Arrival of new players drives both average and median rating down. The lack of new players does the opposite, since skilled players are more likely to remain. There is no other observable factor to rating "inflation"/"deflation".
Without a proper regression analysis you cannot really draw this conclusion. Also, how did you calculate rating? From memory your numbers are different than mine. I suspect you might have calculated rating wrong.
The graph for 'Average games rating, percentage' would make more sense as a stacked bar chart of a stacked area chart. Current the line for >=1000 is this high because it includes ALL games above average 1000 rating. That's not very informative.
-
@IndexLibrorum said in FAF Statistics Megathread 2 Statistics Boogaloo:
I think you posted the same graph twice under Leagues distribution.
Fixed, thank you.
Also, how did you calculate rating? From memory your numbers are different than mine. I suspect you might have calculated rating wrong.
Sum of players' ratings at the beginning of the game divided by the amount of players in the game. This is games' median/average, not players' median/average. If Player1 has 10X more games than Player2, it will have 10X more impact on games' median/average. So it pretty much should give a different number.
The graph for 'Average games rating, percentage' would make more sense as a stacked bar chart of a stacked area chart.
I've reused the template I already had as it's still readable. But ngl that's indeed a better idea, I will take a look at it.
-
@Sainse Awesome! Thanks!
Hello! It looks like you're interested in this conversation, but you don't have an account yet.
Getting fed up of having to scroll through the same posts each visit? When you register for an account, you'll always come back to exactly where you were before, and choose to be notified of new replies (either via email, or push notification). You'll also be able to save bookmarks and upvote posts to show your appreciation to other community members.
With your input, this post could be even better 💗
Register Login