4.4 - Univariate analysis: Gameplayerstats
This chapter looks at the 'Gameplayerstats' dataset. Additionally, the 'LeaderboardRatingJournal' dataset was merged with this dataset, as it is essentially an extension of the GamePlayerStats dataset. Most importantly, merging these two datasets adds the 'leaderboard_id' variable to the GamePlayerStats data, which makes it possible to look at such things as ratings for specific leaderboards. These leaderboards include the Global, 1v1, 2v2, 3v3, etc. leaderboards.
This text was last updated on May 20, 2026.
The size of the faf playerbase
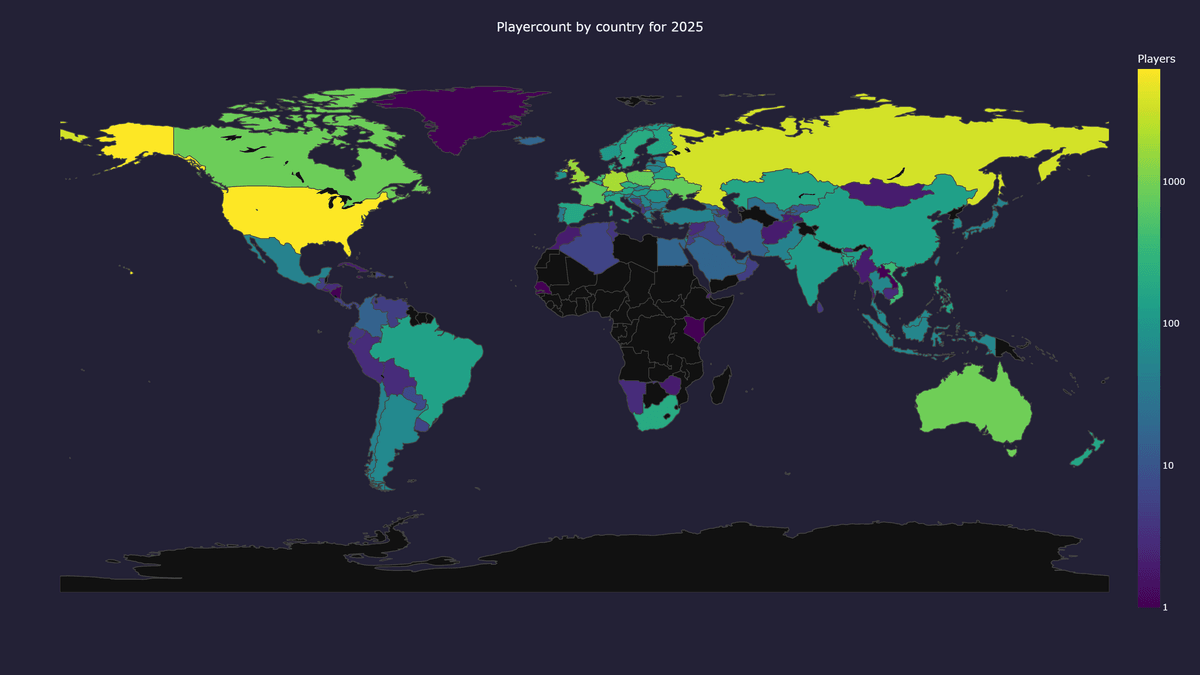
Question: How large is the FAF playerbase?
In 2025 we saw a total of 68638 unique players.
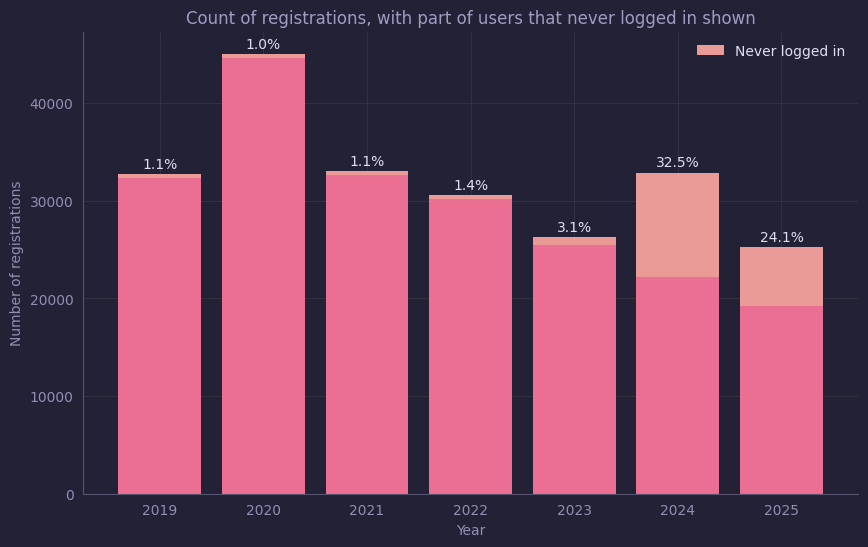
With the gameplayerstats records, we can count the number of unique players that played at least one game in a given year. The plot below shows these counts totalled per year for the years 2020 to 2025.
At our peak, in 2020, we had 84,909 unique players. Our worst year since 2020 was 2025, when we saw 68,638 unique players (-19.2%). Comparing 2025 to the previous year, we similarly saw a decrease from 74,436 to 68,638 (-7.8%). These numbers follow the general trend also seen in the decrease of the number of games and number of registrations in 2025 compared to 2024 and previous years.
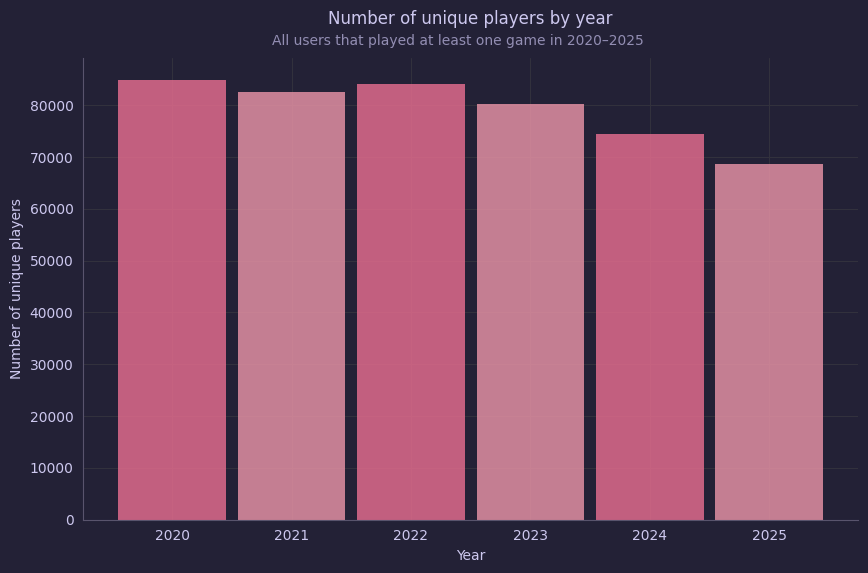
Fig. 1: Count of unique players per year for 2020-2025
We know from the data analyses from previous years that many players only play a few games before they quit and never return. As a consequence, the yearly number of unique users gives us only a partial idea of the size of the playerbase. Players who started playing in January might already be gone in February, even while they still count to the yearly total. We can get a more precise understanding of the size of the FAF playerbase by looking at the monthly counts for these years. While we will take into account the specific number of games individual players play later, for now we will include all players that have played at least one game.
At our peak, in November 2020, we had 25,984 unique monthly players. Our worst month since 2020 was September 2025, when we saw 15,047 unique players. The average over these years was 20,393 unique monthly players. Comparing 2024 with 2025 shows the, by now expected, decrease: 2024 saw a monthly average of 19,043, while 2025 saw 17,127 (-10.1%). These numbers follow the general trend also seen in the decrease of the number of games and number of registrations in 2025 compared to 2024.
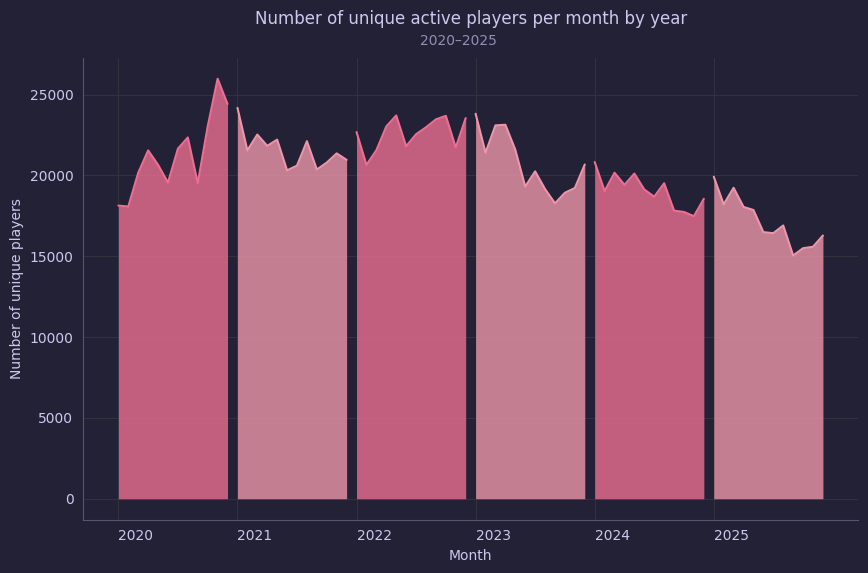
Fig. 2: Count of unique players per month for years 2020-2025
A closer look at average games per player and the number of active players
Question: How many games do players generally play every year?
There's a massive range. Some players play thousands of games, but half of all players active in 2025 played fewer than 15 games that year.
There are several ways to measure player activity, each answering a different question. The two most natural measures are 'time played' and 'number of games played'. Both can be counted as a lifetime total since registration, or broken down by year to track how activity evolves over time.
The right measure depends on the question being asked. Time played is a better proxy for individual engagement and time investment: it tells you how much of a player's life went into the game. Number of games played is a better proxy for community presence and social activity: it reflects how often a player showed up and interacted with others.
For the purpose of understanding the size and health of the FAF playerbase, number of games per year is the more meaningful measure. It better captures the feeling of 'how busy is FAF from day to day' or 'how easy is it to find a game', because every game requires multiple players to be online and willing to play simultaneously. A player who played 100 games last year contributed 100 opportunities for other players to get a match, a metric that directly reflects the lived experience of being part of the community.
However, raw game counts span an enormous range across the playerbase. FAF has a classic long-tail distribution: a small number of highly dedicated players with thousands of games, a moderate core of regular players with tens to hundreds of games, and a large mass of casual or lapsed players with very few games. To understand this distribution, it helps to count how many players fall into each activity bracket. We can, for example, plot the proportion of players have played 1, 10, 100, 1,000, or 10,000 or more games in a given year.
This analysis is important because it allows us to define a meaningful activity cutoff: a minimum game count below which a player is considered inactive or lapsed for the purposes of a given analysis. We need such a cutoff matters because including completely inactive accounts (players who registered, played one game, and never returned) in metrics like 'active playerbase size' or 'rating distribution' would significantly distort the picture. After setting the cutoff, we can then have another look at the 'corrected' size of the playerbase.
The graph below shows the expected distribution: there is a decent chunk of players who play no more than a few tens of games and then not return. The exact distributions are relatively equal between the years, indicating that this is a stable behaviour pattern and not a reaction to external factors, such as intermittent DDOS/connection issues.
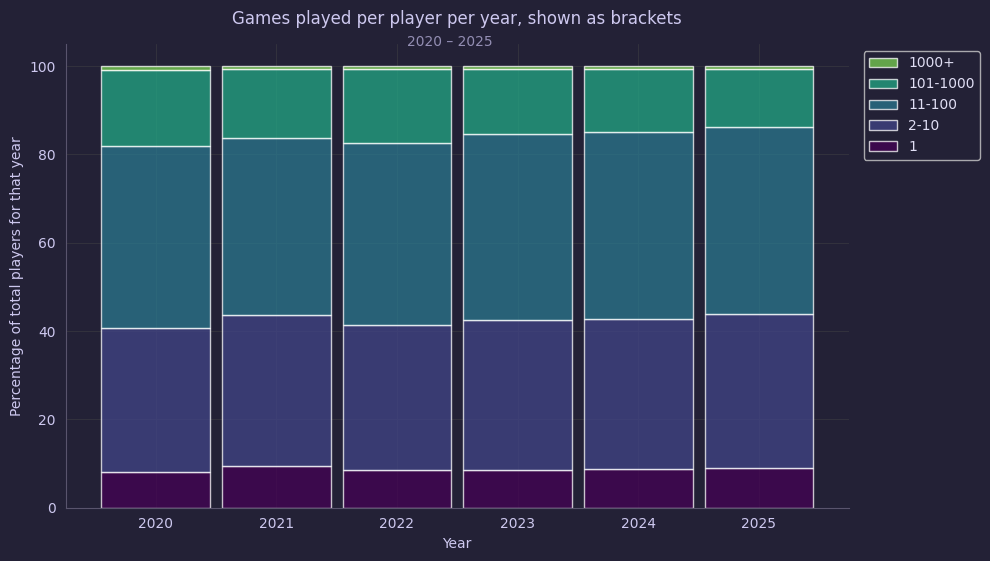
Fig. 3: Players binned by number of games played in that year. Bins stacked as percentage of the year total.
The second graph below plots essentially the same data, but in a different way: it highlights how few games most players actually play. It turns out that any account with more than 100 games is already in the top 15% of most active players.
The practical implication is that the effective playerbase, the players who meaningfully contribute to the lobby/queue experience, is much smaller than the raw active player count suggests. If the median player plays 15 games a year and the mean is around 65 (see table below), a large fraction of the playerbase is effectively invisible to most other players. The community health, matchmaking quality, and lobby activity are driven almost entirely by the extreme right-side portion of the distribution: the players who play weekly or daily and who show up consistently enough to be a reliable presence.
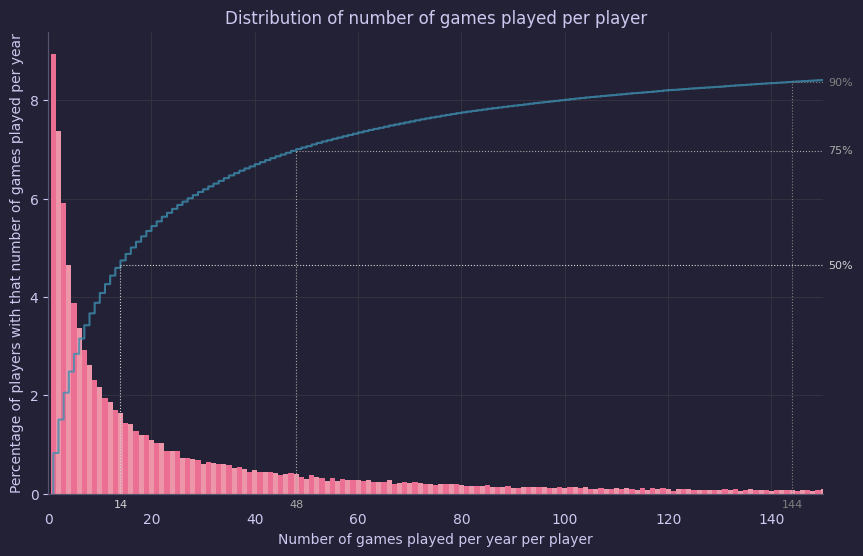
Fig. 4: More than three quarters of the players in 2025 have not played more than 50 games.
In the table below, the median, mean, and max counts per year are noted. For 2025, the median number of games was 14.0. This means that half of all the players that played in 2025, played 14.0 or fewer games. The other half of the playerbase played more than 14.0 games. Because some players play a very large number of games (the largest number in 2025 was 4100 games), the average number of games (mean) is much higher: 62.4 in 2025.
The median and mean values has remained fairly stable since 2021, suggesting that player engagement has not changed meaningfully over time. That said, the numbers for the COVID year of 2020 are higher, as could be expected.
Table: Median, mean, and max values for the years 2020 to 2025.
| year |
median |
mean |
max |
| 2020 |
17.0 |
80.0 |
5615 |
| 2021 |
14.0 |
68.6 |
3650 |
| 2022 |
16.0 |
72.3 |
3277 |
| 2023 |
15.0 |
65.6 |
3815 |
| 2024 |
15.0 |
66.0 |
3978 |
| 2025 |
14.0 |
62.4 |
4100 |
An alternative way of looking at active players
The previous analysis showed that half of all players play 14 or fewer games. We could set this number of games as a cut-off for what we consider an active player. We can check whether or not this makes sense by comparing this with another way of measuring activty: the number of days a player plays at least one game. This would cover a weakness of the first approach, which treats a player who played 14 games in a single day identically to one who played one or two games every month throughout the year, despite these representing fundamentally different engagement patterns.
To capture the full picture, a tiered classification is here made based on the percentage of the days of the year the account is active. When calculating this number, the registration date for new accounts is taken into account: accounts created halfway through the year calculate their engagement as a percentage of the remaining time in that year.
Players who played fewer than 10% of the days (about a month's worth of days) are considered 'churned', which is a term commonly used to describe players who have since left the community. Players with a percentage between 10 and 40 are considered 'casual' players. Between 40 and 75 percent players are considered 'regulars'. Lastly, players who play 75-100% of all days of the year are the hard core of the community.
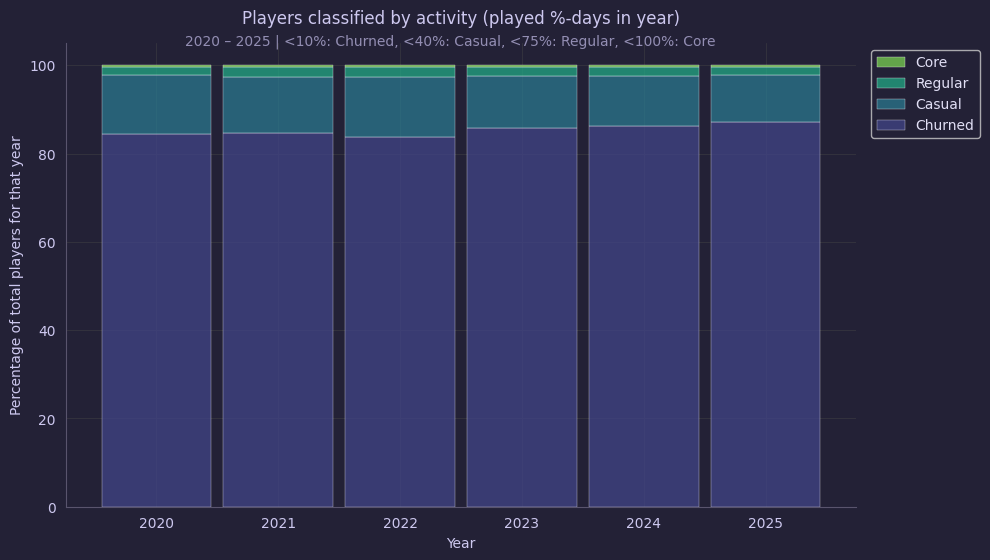
Fig. 6: Classification of players by activity in four tiers.
Most of the playerbase has been binned as 'Churned': 87.1% of the playerbase played at most on 10% of days in the year available to them since registration.
In the 'Churned' group, 50% of players were active for only 4 or fewer days, and the average was not much higher at 7.3. In this time, these players had a median played number of games of 10, with a mean (average) of 22.2. This is worth repeating: 87.1% of all unique yearly players stay for no more than 4 days and play no more than 10 games, before quitting FAF. Even converting a fraction of these 59,814 players in 2025 alone would have a significant effect on the size of the FAF playerbase.
Looking at these numbers we can conclude that the cutoff of 14 games is at least vaguely in the right ballpark: The median and mean for the next category, the 'Casual' players, were at 182.0 and 228.7 respectively; a very different population, as can also be seen in the graph below.
In the graph below, the distribution for the number of games played per activity tier is plotted. It is worth nothing that while the way this graph is plotted might make it look like the 'Casual' group is at least somewhat similar sized, but this is not correct. The 'Churned' group contains more players than the other three together, six times over. Although the distributions show some overlap, the 'Churned' and 'Casual' tiers have clearly distinct distributions. The value for the earlier set cut-off value of 14 is marked on the x-axis. Also marked is the new cut-off value proposed based on these distributions, at 70 games played. This value covers the majority of players from the 'Churned' category, while barely removing any players from the 'Casual' tier.
Setting the cut-off makes sense for the context in which we need such a cutoff: when looking at statistics such as the average rating of the playerbase, players whose rating has not quite yet stabilized should not be included. We have to keep in mind, however, that this excludes a huge chunk of the total playerbase: 85.6%.
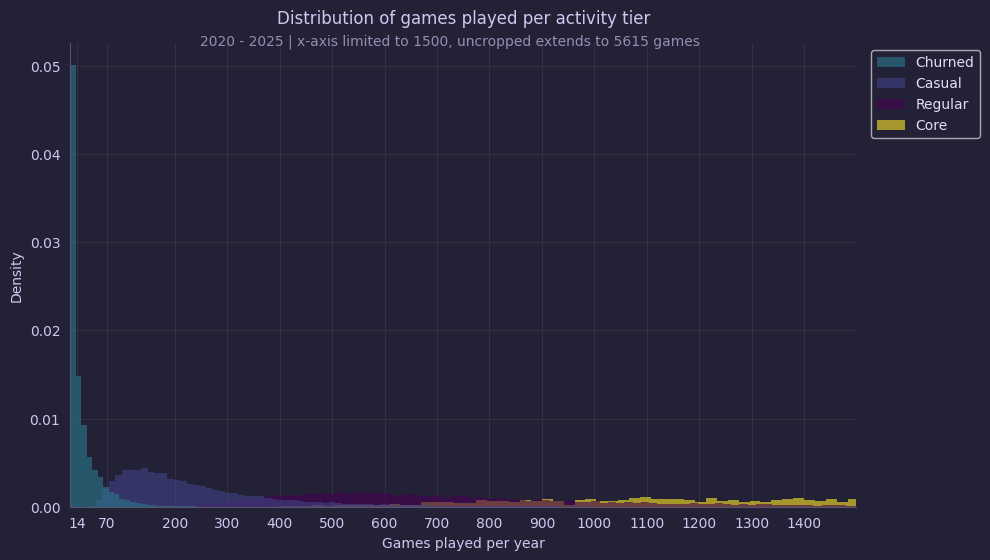
Fig. 8: The distributions for the number of games played per activity tier.
Top 10 most active players in 2025 by game count and days played
We've looked a lot at the players who barely played, so here's a table with all those players who've played exceedingly often in 2025, to balance it out. This table shows two top-10 ranked lists; the left list shows the players ranked by percentage of the year they've played, the right the top-10 ranked by total number of games played.
In previous years, we had one or two players who played all days of the year. In 2025, however, the highest we've gotten is 99%. The number one, 'SiilentBug', played 360 of 365 days, four more than the runner up.
Table: The top 10 players ranked by percentage of days played on the left, and ranked by number of games played on the right
| Rank by percentage of days played |
Username |
Percentage of days played |
Number of games played |
|
Rank by games played |
Username |
Percentage of days played |
Number of games played |
| 0 |
SiilentBug |
0.99 |
3240 |
|
0 |
Titaanbierdopje |
0.69 |
4100 |
| 1 |
M83 |
0.98 |
2827 |
|
1 |
Babel- |
0.93 |
3999 |
| 2 |
Moskito |
0.97 |
1335 |
|
2 |
im_lagger |
0.92 |
3412 |
| 3 |
Yew |
0.97 |
2064 |
|
3 |
AKarmy01 |
0.71 |
3329 |
| 4 |
Flee |
0.96 |
882 |
|
4 |
SiilentBug |
0.99 |
3240 |
| 5 |
MrBlueMoon |
0.96 |
2442 |
|
5 |
boss1100 |
0.91 |
3166 |
| 6 |
Firv |
0.95 |
1904 |
|
6 |
up-and-down |
0.61 |
3143 |
| 7 |
Rewer |
0.94 |
2682 |
|
7 |
chucups |
0.93 |
2891 |
| 8 |
TexasDeath |
0.94 |
1929 |
|
8 |
plum- |
0.88 |
2872 |
| 9 |
HY_R9 |
0.94 |
1123 |
|
9 |
totus-s |
0.62 |
2834 |
Rating distribution for global leaderboard
Question: What does the rating distribution for the global leaderboard look like?
The median rating for all players that played at least one game between 2020 and 2025 was 534 on December 31st 2025.
With the gameplayerstats records, we can get the latest update to the rating for each player that played at least one rated game. The first graph below looks only at the global leaderboard specifically, and only for the years 2020-2025, but includes all players from those years.
A few things can be noticed. First, the median rating is 534, which means that the on December 31st 2025, the rating for 50% of all players that played between 2020 and 2025 is below 534. This might be surprising, since 1000-rated players are often referred to as average. Instead, a 1000-rated player is already better than 84.2% of all players; well above average. Incidentally, the percentages for 1500- and 2000-rated players are 98.3% and 99.8%, respectively.
Looking at the graph, we see a noticeable spike for the '-100 to 0' ratings bin. As we'll see below, this spike almost entirely disappears when we use our previously set cut-off of 70 games to exclude churned and new players. This might indicate that people stop playing once they get negative rating, something that is likely to happen when a completely new player joins competitive lobbies and loses their first tens of games. Given the large number of players in this bin, having a better tutorial or onboarding system for new users may greatly benefit the size of our playerbase.
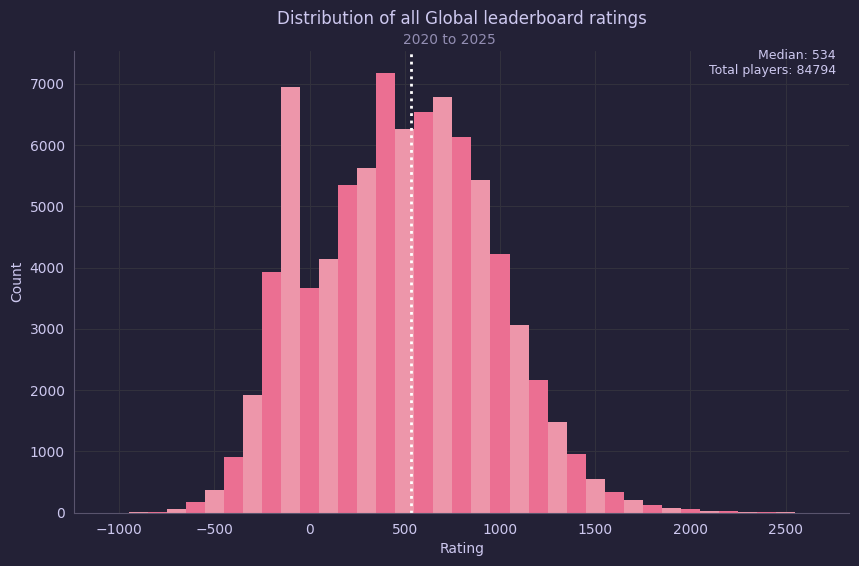
Fig. 10: Global leaderboard ratings as per December 31st 2025, for all players who played between 2020 and 2025. The median is 534.
Rating distribution for global leaderboard
When we remove all players who haven't played at least 70 games from the dataset, the large spike in the -100 to 0 rating bin nearly disappears. This indicates that it is indeed the churned players who are responsible for this pike. The median also shifts, as expected: from 534 to 757. A comprehensive table of the data for both sets is shown below.
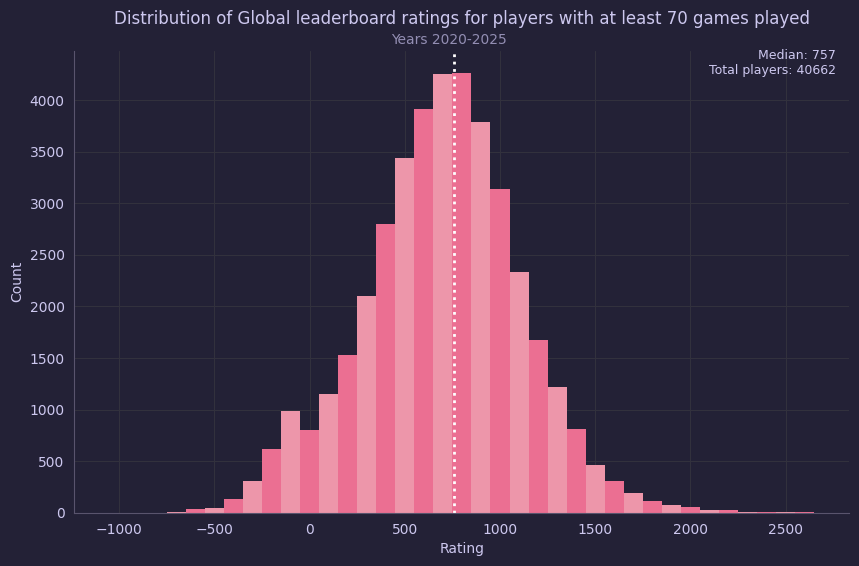
Fig. 11: Global leaderboard ratings as per December 31st 2025, for all players who played between 2020 and 2025. The median is 534.
Table: Table with the general stats on the Global leaderboard ratings.
| All players |
|
|
Non-churned players |
|
| count |
84794.00 |
|
count |
40662.00 |
| mean |
531.09 |
|
mean |
744.42 |
| std |
462.22 |
|
std |
416.42 |
| min |
-887.71 |
|
min |
-752.24 |
| 25% |
179.16 |
|
25% |
487.39 |
| 50% |
533.84 |
|
50% |
757.35 |
| 75% |
860.39 |
|
75% |
1008.80 |
| 90% |
1118.67 |
|
90% |
1251.32 |
| 95% |
1280.67 |
|
95% |
1406.77 |
| 96% |
1332.70 |
|
96% |
1450.55 |
| 99% |
1614.99 |
|
99% |
1756.44 |
| 99.5% |
1763.22 |
|
99.5% |
1909.90 |
| 99.8% |
2000.73 |
|
99.8% |
2137.49 |
| max |
2700.93 |
|
max |
2700.93 |
Rating distribution for ladder leaderboards
Question: Are the rating distributions for the ladder leaderboards similar to global, and to each other?
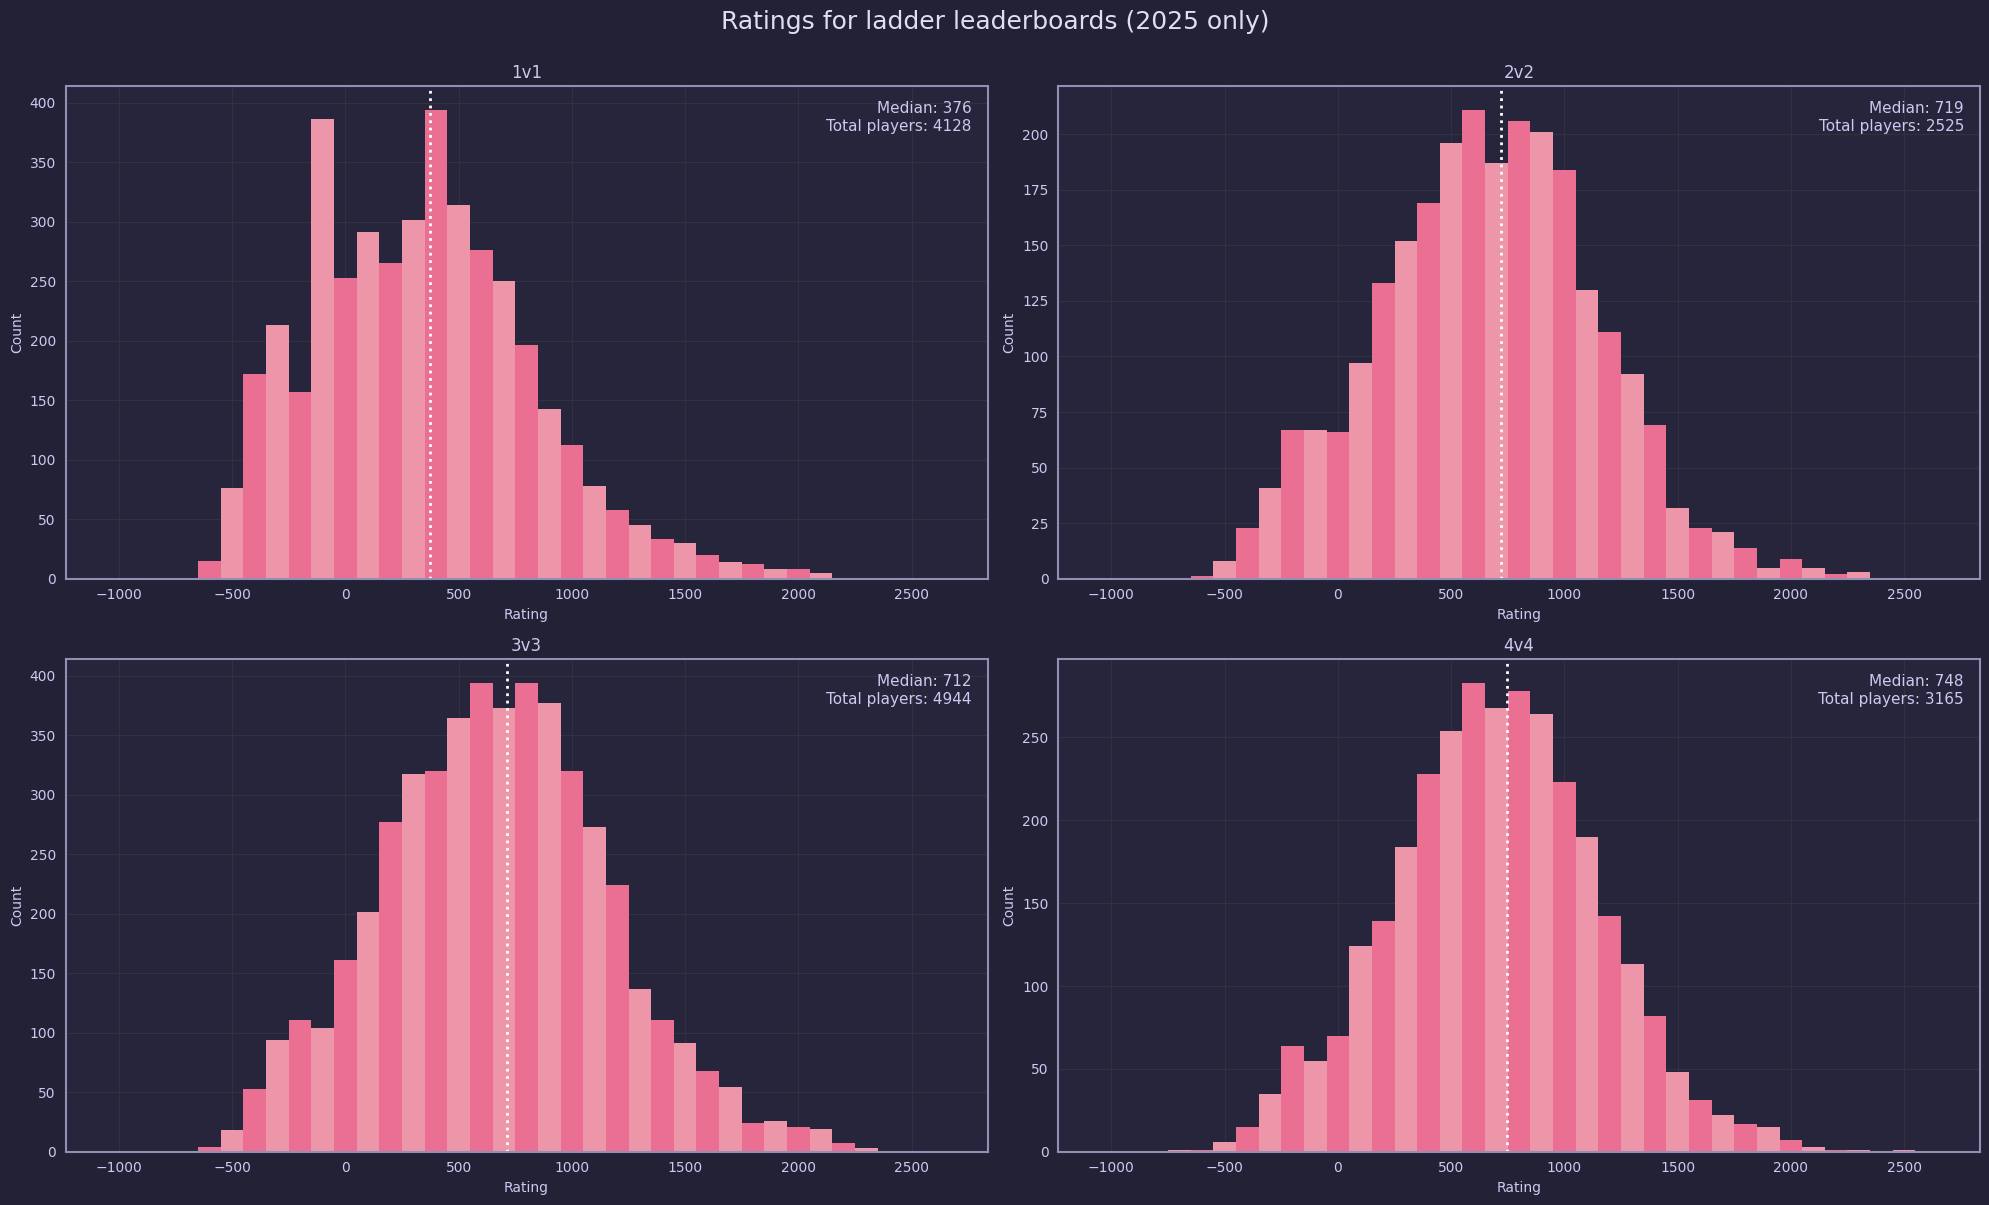
The 1v1 ladder's distribution differs from the rest. All of them have means that differ from the global leaderboard's mean.
The ratings, as measured on December 31st 2025, for all players who played at least one game in 2025 were plotted. With the exception of the 1v1 bracket, which was 376, the medians for the ratings for the leaderboard was around 720-750. Given that the global uncorrected median was 534, the distributions for the global and ladder leaderboards differ significantly.
The data for the 1v1 bracket is more noisy than the other brackets, and the spikes at 500 and -100 might indicate that many players played only a few games, or stopped once their rating became negative, similar to the spikes seen in the global, uncorrected, rating distribution.
")