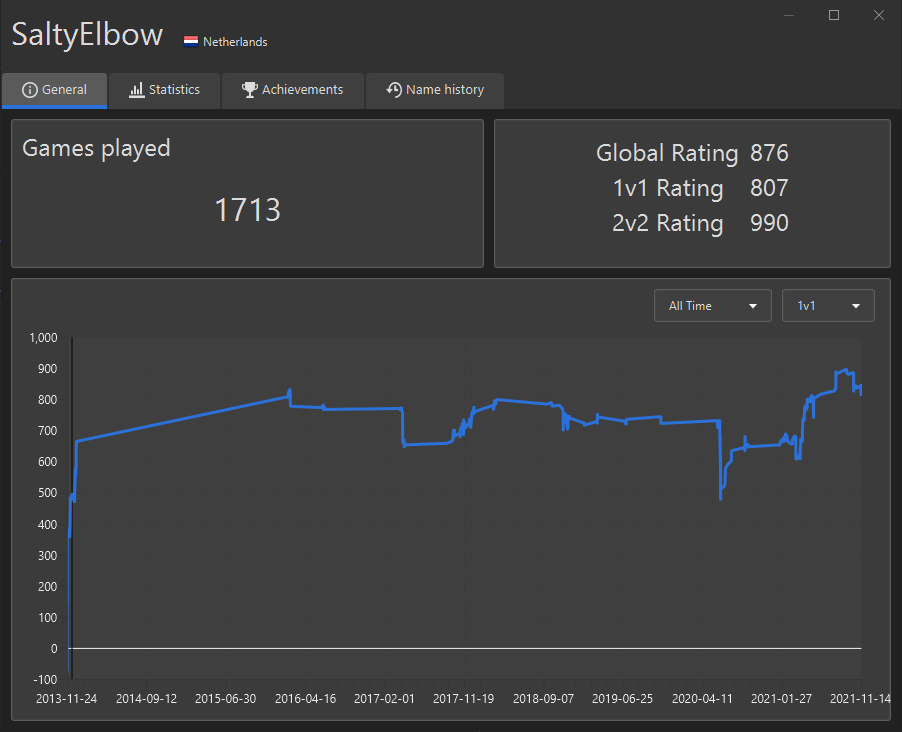
1 vs 1 stats graph looks horrible
-
Looks fine to me. Why would you want a totally wonky time scale on the graph instead of an accurate representation of how your ratings changed over time?
-
actually this graph can looks better if it will use games instead of date of game played...
-
It just sounds like you are incapable of reading the graph properly. It's your rating over time; when you don't play for some time there's obviously going to be "no data". Just because you don't understand that doesn't mean it's "crap".
What you want is probably what Eternal said, a graph of your rating by games, not by time. -
@femtozetta is it okay if have my own opinion on what I think is crap or not? I don't need someone else to tell my what my opinions are. As for the graph; it used to be different. The new version is less useful in my opinion so I think this one is more crappy! I already understood I was asking for a different graph. I asked if there is an option to tweak it. As stated by Sheikah. "No there is no option"
Freaking toxic community!
-
@saltyelbow we are not toxics. only you think that we are toxics. zoomer

-
@saltyelbow said in 1 vs 1 stats graph looks horrible:
Freaking toxic community!
You came here and said it's horrible and crap. It's people like you who make it toxic.
It's ok to have your own opinion, but you're a clown for getting all pissy after getting called out for how you presented yours. -
@femtozetta I sometimes like to be salty. People who are going to use picky words to always say the other is wrong don't really listen to the message between the sentences. So you must be always right, but yeah not really a fun person to be with. I prefer clowns over known-it-all persons.
Have fun knowing it all!
-
And the true colors reveal themselves…
-

-
The question has been answered
-
 D Deribus locked this topic on
Hello! It looks like you're interested in this conversation, but you don't have an account yet.
Getting fed up of having to scroll through the same posts each visit? When you register for an account, you'll always come back to exactly where you were before, and choose to be notified of new replies (either via email, or push notification). You'll also be able to save bookmarks and upvote posts to show your appreciation to other community members.
With your input, this post could be even better 💗
Register Login