FAF Statistics Megathread 3: FAF Statistics Megathread 3: The stats are at it again
-
#2 - Key stats and figures
Yearly registrations have been decreasing since 2020
In 2025, the amount of users that logged in at least once was less than half that of the COVID peak year.
Since the COVID peak of 2020, each subsequent year got fewer registrations. Furthermore, a big chunk of those registrations never logs in even once. This was likely similarly the case for the years before 2023, but we have no data on this as these accounts were purged from the database some time in 2023.

New clans are still created, but few people join clans
New clans are still created in 2025, at a fairly comparable rate to previous years, with the exception of 2024 (which saw a huge spike). However, only a tiny portion of the playerbase is actually in a clan.
2025 saw fewer created games than previous years (post-COVID)
There is a clear difference between pre- and post-COVID years for all measures of activity. Compared to any of the post-COVID years, 2025 saw fewer games created than the years before.
A small percentage of all players is responsible for most of the games played
Half of all players play fewer than 14 games. Consequently, a small percentage of all the players play a lot of games: any player with more than 144 games is in the top-10% of players by number of games played.
The median rating for non-churned/non-new players is only 757
Typically, a rating of 1000 is considered average. However, the data shows that the actual median is significantly lower, at 757. This is the median for players with a minimum of 70 games, which excludes churned and new players. If those were included, the median would be even lower at 534.
Activity peaks on weekends around 19:00
As can be expected, most games are started in the weekends. Saturday and Sunday around 19:00 is busiest, while Tuesday 06:00 is quietest. This is mostly a consequence of the majority of our players being from Europe and Russia.

-
#3 - Data collection and Data schema documentation
Summary:
This post contains information about the data used for this project, including a data dictionary and some basic statistics of numeric columns. This dataset is limited to data from 2025.
A new tool was created to use the FAF API to easily download data from the FAF database in bulk. This tool is available for download here.
The dataset
This data analysis draws on the following datasets, downloaded from the FAF database:
- Players
- Clans
- Games
- GamePlayerStats
- LeaderboardRatingJournal
- Maps
- MapVersions
- Reports
- Bans
All datasets contain the records for the year 2025, with the exception of the Players and Clans dataset, which contain all the data since the start of the FAF project in 2012. A full data dictionary for these datasets can be found below.
The data was downloaded in bulk by using a new tool I created for this project. More information about the tool, as well as a download link, are available on its github page.
Data accessibility
As several of the datasets contain private information, the datasets themselves will not be released to the wider public. If you're part of a FAF team (e.g., balance, moderation, events) or just an interested player and would be interested in access to more detailed data, feel free to reach out however. I’m happy to try to provide anonymized raw data segments on request if you want to dig deeper or cross-check any findings.
Players
Purpose: Contains the information of all users who registered a FAF account. Includes all registered users, not just those that registered in 2025.
Size: 408,316 rows by 17 columns.Dataframe details
Column name Datatype Number of null values Percentage of null values Number of unique values Percentage of unique values Sample of values id int64 0 0.00% 408,316 100.00% 5, 6, 7 createTime datetime64[ns, UTC] 0 0.00% 393,729 96.43% 2012-02-27 19:49:50+00:00, 2012-08-27 19:30:55+00:00, 2012-08-29 19:41:12+00:00 lastLogin datetime64[ns, UTC] 120,558 29.53% 286,818 70.24% 2020-10-13 11:58:28+00:00, 2023-07-13 14:02:00+00:00, 2025-03-27 01:54:24+00:00 login str 1 0.00% 408,315 100.00% Ze_PilOt, Ephez, Kekouse recentIpAddress str 144,871 35.48% 228,668 56.00% Samples not shown for privacy reasons. updateTime datetime64[ns, UTC] 0 0.00% 197,765 48.43% 2018-09-10 05:24:07+00:00, 2025-07-15 08:52:28+00:00, 2025-07-24 18:19:26+00:00 userAgent str 78,335 19.18% 6 0.00% downlords-faf-client, faf-client, downlords-faf-client-0.6.30.2-alpha accountLinks_ids str 0 0.00% 296,941 72.72% Samples not shown for privacy reasons. avatarAssignments_ids str 0 0.00% 823 0.20% ['161', '378', '488', '490'], [], ['396'] bans_ids str 0 0.00% 6,347 1.55% [], ['1165', '9679'], ['3064'] clanMembership_id Int64 399,084 97.74% 9,232 2.26% 12302, 6143, 6152 names_ids str 0 0.00% 26,218 6.42% [], ['2775', '7571', '11614', '32509'], ['170', '346', '391', '858', '13342', '13624', '13871', '15495', '15780', '16316', '16551', '17758', '19218', '19629'] reportedOnModerationReports_ids str 0 0.00% 8,264 2.02% Samples not shown for privacy reasons. reporterOnModerationReports_ids str 0 0.00% 7,897 1.93% Samples not shown for privacy reasons. uniqueIdAssignments_ids str 0 0.00% 234,248 57.37% [], ['1', '2'], ['3'] userNotes_ids str 0 0.00% 144 0.04% [], ['62', '63'], ['92'] userGroups_ids str 408,315 100.00% 1 0.00% ['28']
Clans
Purpose: Contains the information of all players who joined a clan. Includes all data on file, not just those clans that registered in 2025.
Size: 2,835 rows by 12 columns.Dataframe details
Column name Datatype Number of null values Percentage of null values Number of unique values Percentage of unique values Sample of values id int64 0 0.00% 2,835 100.00% 21, 24, 25 createTime datetime64[ns, UTC] 0 0.00% 2,834 99.96% 2014-02-16 19:26:41+00:00, 2014-02-16 21:05:31+00:00, 2014-02-16 21:05:46+00:00 description str 473 16.68% 2,335 82.36% Developers, trying to improve FAF for you., This clan was founded by a player called Epic, who is sadly not active anymore. It is classified by its democratic system (new members need to pass a vote), and also a minimum rating of 1500 is required (exceptions under special circumstances are possible). Bad Company developed into a clan regularly hosting high class teamgames and consisting of high-level players. It won the clan tournament "Intergalactic Colosseum 6" ahead of any other participating clan. To join BC, you should pm any of our members., http://obliteratingwave.co.uk/ name str 1 0.04% 2,834 99.96% FAF Developers, Bad Company, Obliterating Wave requiresInvitation bool 0 0.00% 1 0.04% True tag str 2 0.07% 2,833 99.93% DEV, BC, O-W tagColor float64 2,835 100.00% 0 0.00% updateTime datetime64[ns, UTC] 0 0.00% 2,832 99.89% 2014-02-16 19:26:41+00:00, 2014-02-16 21:05:31+00:00, 2014-02-16 21:05:46+00:00 websiteUrl str 0 0.00% 2,835 100.00% https://clans.faforever.com/clan/21, https://clans.faforever.com/clan/24, https://clans.faforever.com/clan/25 founder_id int64 0 0.00% 2,828 99.75% 82526, 20519, 29 leader_id int64 0 0.00% 2,835 100.00% 73910, 20967, 29 memberships_ids str 0 0.00% 2,835 100.00% ['7255', '11327', '11333', '11334', '11809', '12145', '12249', '12555'], ['6582', '6589', '6590', '6591', '6592', '6593', '6595', '6596', '6597', '6598', '6599', '6600', '6602', '6604', '6605', '6606', '6608', '6609', '6610', '10642', '19235', '19253'], ['6143', '6144']
Games
Purpose: Contains the information about one particular game played. Essentially: one hosted lobby.
Replayticksare measured in 100ms: divide by 10 to get the replay duration in seconds. This table is linked to theleaderboardRatingJournaltable through theplayerStats_idsvalues, as well as to themapVersiontable.
Size: 1,678,634 rows by 15 columns.Dataframe details
Column name Datatype Number of null values Percentage of null values Number of unique values Percentage of unique values Sample of values id int64 0 0.00% 1,678,634 100.00% 23968003, 23968009, 23968015 endTime datetime64[ns, UTC] 1,916 0.11% 1,621,625 96.60% 2025-01-01 00:48:44+00:00, 2025-01-01 00:02:05+00:00, 2025-01-01 00:08:54+00:00 name str 218 0.01% 200,919 11.97% am testing, Chilling, VS AI replayAvailable bool 0 0.00% 2 0.00% True, False replayTicks Int64 56,396 3.36% 93,194 5.55% 20403, 132, 5039 replayUrl str 0 0.00% 1,678,634 100.00% https://content.faforever.com/replays/0/23/96/80/23968003.fafreplay, https://content.faforever.com/replays/0/23/96/80/23968009.fafreplay, https://content.faforever.com/replays/0/23/96/80/23968015.fafreplay startTime datetime64[ns, UTC] 0 0.00% 1,626,104 96.87% 2025-01-01 00:00:16+00:00, 2025-01-01 00:01:41+00:00, 2025-01-01 00:02:05+00:00 validity str 0 0.00% 22 0.00% UNKNOWN_RESULT, BAD_MOD, HAS_AI victoryCondition str 0 0.00% 5 0.00% DEMORALIZATION, DOMINATION, SANDBOX featuredMod_id int64 0 0.00% 5 0.00% 0, 4, 25 host_id int64 0 0.00% 52,694 3.14% 469850, 518019, 19839 mapVersion_id Int64 556,751 33.17% 9,334 0.56% 25885, 22605, 566 playerStats_ids str 0 0.00% 1,670,618 99.52% ['47734162'], ['47734163'], ['47734164'] reviews_ids str 0 0.00% 80 0.00% [], ['53569'], ['53568'] reviewsSummary_id Int64 1,678,555 100.00% 79 0.00% 23997503, 23997612, 24043898 Basic statistics
mean std min 25% 50% 75% max replayTicks 18645.4 41866.4 0 3713 13409 26206 2.63817e+07
Gameplayerstats
Purpose: Contains information about a single player who participated in a single game. Includes rating information and some of the player-related data that is shown in the replay vault. This table is linked to the
GamesandPlayerstables.
Size: 2,653,694 rows by 16 columns.Dataframe details
Column name Datatype Number of null values Percentage of null values Number of unique values Percentage of unique values Sample of values id int64 0 0.00% 2,653,694 100.00% 47733448, 47733449, 47733937 afterDeviation float64 1,198,338 45.16% 308,322 11.62% 70.3481, 67.9957, 191.831 afterMean float64 1,198,338 45.16% 370,899 13.98% 916.836, 1076.97, 1069.26 ai bool 0 0.00% 1 0.00% False beforeDeviation float64 0 0.00% 313,151 11.80% 500.0, 70.76, 68.2702 beforeMean float64 0 0.00% 371,796 14.01% 1500.0, 898.49, 1094.07 color int64 0 0.00% 19 0.00% 6, 9, 5 faction int64 0 0.00% 6 0.00% 4, 2, 3 result str 0 0.00% 5 0.00% VICTORY, DEFEAT, UNKNOWN score int64 0 0.00% 4 0.00% 10, -10, 0 scoreTime datetime64[ns, UTC] 0 0.00% 691,736 26.07% 2025-01-01 00:01:31+00:00, 2025-01-01 00:02:06+00:00, 2025-01-01 00:03:07+00:00 startSpot int64 0 0.00% 16 0.00% 3, 1, 2 team int64 0 0.00% 13 0.00% 2, 3, 1 game_id Int64 0 0.00% 699,903 26.37% 23967619, 23967860, 23967783 player_id int64 0 0.00% 52,587 1.98% 168949, 168950, 410682 ratingChanges_ids str 0 0.00% 1,455,357 54.84% [], ['20495760'], ['20495761'] Basic statistics
mean std min 25% 50% 75% max beforeDeviation 180.985 145.194 45.4126 98.1705 105.489 189.573 500 beforeMean 1344.96 387.844 -141.697 1078.79 1360.55 1525.02 3919.5 afterDeviation 111.024 48.3926 48.0604 94.4832 102.738 106.356 499.995 afterMean 1345.19 422.832 -141.697 1051.3 1311.43 1610.28 3902.36 team 2.3745 0.659926 1 2 2 3 13
Leaderboardratingjournal
Purpose: Contains the information sent to the server to update the leaderboard records. This table is linked to corresponding entriese in the
gamePlayerStatstable.
Size: 1,464,010 rows by 9 columns.Dataframe details
Column name Datatype Number of null values Percentage of null values Number of unique values Percentage of unique values Sample of values id int64 0 0.00% 1,464,010 100.00% 20495760, 20495761, 20495762 createTime datetime64[ns, UTC] 0 0.00% 224,210 15.31% 2025-01-01 00:02:06+00:00, 2025-01-01 00:03:07+00:00, 2025-01-01 00:03:45+00:00 deviationAfter float64 0 0.00% 310,089 21.18% 70.3481, 67.9957, 191.831 deviationBefore float64 0 0.00% 306,125 20.91% 70.76, 68.2702, 195.238 meanAfter float64 0 0.00% 371,256 25.36% 916.836, 1076.97, 1069.26 meanBefore float64 0 0.00% 369,884 25.27% 898.49, 1094.07, 1086.04 updateTime datetime64[ns, UTC] 0 0.00% 224,210 15.31% 2025-01-01 00:02:06+00:00, 2025-01-01 00:03:07+00:00, 2025-01-01 00:03:45+00:00 gamePlayerStats_id int64 0 0.00% 1,455,356 99.41% 47733937, 47733938, 47734076 leaderboard_id int64 0 0.00% 5 0.00% 1, 2, 6 Basic statistics
mean std min 25% 50% 75% max deviationBefore 112.782 55.0281 47.3337 94.5262 102.77 106.397 500 meanBefore 1346.97 421.358 -141.697 1054.23 1315.44 1608.97 3919.5 deviationAfter 111.538 49.7718 48.0604 94.5082 102.747 106.378 499.995 meanAfter 1345.56 422.23 -141.697 1052.23 1312.25 1610.39 3902.36
Maps
Purpose: Contains the information on maps uploaded by users to the FAF vault.
Size: 655 rows by 14 columns.Dataframe details
Column name Datatype Number of null values Percentage of null values Number of unique values Percentage of unique values Sample of values id int64 0 0.00% 655 100.00% 14051, 14052, 14053 battleType str 0 0.00% 1 0.15% FFA createTime datetime64[ns, UTC] 0 0.00% 655 100.00% 2025-01-01 02:10:45+00:00, 2025-01-01 18:42:34+00:00, 2025-01-01 20:45:08+00:00 displayName str 0 0.00% 655 100.00% Galactic Clutch, Quad Pass TeamPlay AI 5v5, Galactic Clutch Fun Edition gamesPlayed int64 0 0.00% 178 27.18% 420, 66, 214 mapType str 0 0.00% 2 0.31% skirmish, special recommended bool 0 0.00% 1 0.15% False updateTime datetime64[ns, UTC] 0 0.00% 655 100.00% 2026-01-04 16:05:52+00:00, 2025-11-04 21:38:35+00:00, 2026-01-04 16:19:10+00:00 author_id int64 0 0.00% 173 26.41% 375791, 80779, 533175 latestVersion_id int64 0 0.00% 655 100.00% 29894, 29900, 29901 license_id int64 0 0.00% 1 0.15% 1 reviewsSummary_id Int64 655 100.00% 0 0.00% statistics_id int64 0 0.00% 655 100.00% 14051, 14052, 14053 versions_ids str 0 0.00% 655 100.00% ['29894'], ['29898', '29900'], ['29901'] Basic statistics
mean std min 25% 50% 75% max gamesPlayed 64.7038 104.712 0 15 32 67.5 1092
Mapversions
Purpose: Contains detailed information about specific versions of a map.
Size: 1,546 rows by 20 columns.Dataframe details
Column name Datatype Number of null values Percentage of null values Number of unique values Percentage of unique values Sample of values id int64 0 0.00% 1,546 100.00% 29893, 29894, 29895 createTime datetime64[ns, UTC] 0 0.00% 1,546 100.00% 2025-01-01 01:46:12+00:00, 2025-01-01 02:10:45+00:00, 2025-01-01 03:16:40+00:00 description str 486 31.44% 432 27.94% Adaptive map. Gap similar map, but without cancer , Dozens of battles have been fought over the years across the Clutch. A frustrated man had to try his best making it balanced experiece without losing the feel of the original map. Surprisingly it only took few hours to do, Map by Leidra. Adapted for 5v5. downloadUrl str 0 0.00% 1,546 100.00% https://content.faforever.com/maps/many_gaps_2.v0030.zip, https://content.faforever.com/maps/galactic_clutch.v0002.zip, https://content.faforever.com/maps/many_gaps_2.v0031.zip filename str 0 0.00% 1,546 100.00% maps/many_gaps_2.v0030.zip, maps/galactic_clutch.v0002.zip, maps/many_gaps_2.v0031.zip folderName str 0 0.00% 1,546 100.00% many_gaps_2.v0030, galactic_clutch.v0002, many_gaps_2.v0031 gamesPlayed int64 0 0.00% 192 12.42% 3, 420, 2 height int64 0 0.00% 5 0.32% 1024, 512, 2048 hidden bool 0 0.00% 2 0.13% False, True maxPlayers int64 0 0.00% 17 1.10% 12, 8, 10 ranked bool 0 0.00% 2 0.13% True, False thumbnailUrlLarge str 0 0.00% 1,546 100.00% https://content.faforever.com/maps/previews/large/many_gaps_2.v0030.png, https://content.faforever.com/maps/previews/large/galactic_clutch.v0002.png, https://content.faforever.com/maps/previews/large/many_gaps_2.v0031.png thumbnailUrlSmall str 0 0.00% 1,546 100.00% https://content.faforever.com/maps/previews/small/many_gaps_2.v0030.png, https://content.faforever.com/maps/previews/small/galactic_clutch.v0002.png, https://content.faforever.com/maps/previews/small/many_gaps_2.v0031.png updateTime datetime64[ns, UTC] 0 0.00% 1,545 99.94% 2025-01-01 02:50:29+00:00, 2026-01-04 16:05:52+00:00, 2025-01-01 04:08:44+00:00 version int64 0 0.00% 83 5.37% 30, 2, 31 width int64 0 0.00% 5 0.32% 1024, 512, 2048 map_id int64 0 0.00% 737 47.67% 7728, 14051, 14052 reviews_ids str 0 0.00% 59 3.82% [], ['7306'], ['7154'] reviewsSummary_id Int64 1,487 96.18% 59 3.82% 7946, 7716, 7717 statistics_id int64 0 0.00% 1,546 100.00% 29893, 29894, 29895 Basic statistics
mean std min 25% 50% 75% max gamesPlayed 38.912 126.872 0 2 12 37 3964 maxPlayers 8.58085 3.84021 0 6 8 12 17 version 7.2749 16.3658 1 1 2 6 178
Reports
Purpose: Contains the information of all the reports the moderation team received from users.
Size: 4,033 rows by 13 columns.Dataframe details
Column name Datatype Number of null values Percentage of null values Number of unique values Percentage of unique values Sample of values id int64 0 0.00% 4,033 100.00% 51464, 51465, 51466 createTime datetime64[ns, UTC] 0 0.00% 3,912 97.00% 2025-01-01 03:55:19+00:00, 2025-01-01 03:59:29+00:00, 2025-01-01 05:06:41+00:00 gameIncidentTimecode str 997 24.72% 1,758 43.59% 20mins plus, less 5 min, all of it moderatorNotice str 14 0.35% 976 24.20% Please report again with the ReplayID., Thank you for bringing this to our attention. Action was taken., If you play a game with union control turned on, you agree to your teammates using your units. Unless the player was intentially griefing by destroying units, using your units is not a bannable offense. moderatorPrivateNote str 3,716 92.14% 225 5.58% Samples not shown for privacy reasons. reportDescription str 6 0.15% 3,624 89.86% Samples not shown for privacy reasons. reportStatus str 0 0.00% 2 0.05% DISCARDED, COMPLETED updateTime datetime64[ns, UTC] 0 0.00% 3,667 90.92% 2025-01-01 03:55:19+00:00, 2025-01-01 03:59:29+00:00, 2025-01-01 05:06:41+00:00 bans_ids str 0 0.00% 915 22.69% [], ['8084'], ['8083'] game_id Int64 1,077 26.70% 2,227 55.22% Samples not shown for privacy reasons. lastModerator_id int64 0 0.00% 11 0.27% 67103, 449782, 285733 reportedUsers_ids str 0 0.00% 1,748 43.34% Samples not shown for privacy reasons. reporter_id int64 0 0.00% 1,461 36.23% Samples not shown for privacy reasons.
Bans
Purpose: Contains the information on bans given by the moderation team.
Size: 1,542 rows by 12 columns.Dataframe details
Column name Datatype Number of null values Percentage of null values Number of unique values Percentage of unique values Sample of values id int64 0 0.00% 1,542 100.00% 8081, 8082, 8083 createTime datetime64[ns, UTC] 0 0.00% 1,542 100.00% 2025-01-01 16:01:42+00:00, 2025-01-01 16:04:33+00:00, 2025-01-01 16:05:55+00:00 expiresAt datetime64[ns, UTC] 383 24.84% 1,157 75.03% 2025-01-29 16:01:41+00:00, 2025-01-07 16:04:33+00:00, 2025-01-02 16:05:55+00:00 level str 0 0.00% 2 0.13% GLOBAL, VAULT reason str 0 0.00% 1,194 77.43% Samples not shown for privacy reasons. revokeReason str 1,393 90.34% 134 8.69% Samples not shown for privacy reasons. revokeTime datetime64[ns, UTC] 1,393 90.34% 149 9.66% 2025-12-15 11:05:29+00:00, 2025-01-06 11:55:43+00:00, 2025-01-21 06:43:05+00:00 updateTime datetime64[ns, UTC] 0 0.00% 1,542 100.00% 2025-01-01 16:01:42+00:00, 2025-01-01 16:04:33+00:00, 2025-01-01 16:05:55+00:00 author_id int64 0 0.00% 12 0.78% 67103, 449782, 100416 moderationReport_id Int64 601 38.98% 914 59.27% 51470, 51469, 51465 player_id int64 0 0.00% 1,086 70.43% Samples not shown for privacy reasons. revokeAuthor_id Int64 1,393 90.34% 9 0.58% 449782, 67103, 100416
-
#4 - Simple analyses
I am starting with simple, mostly univariate, analyses, one dataset at the time. An univariate analysis focusses on the qualities of a single variable, such as looking at the distribution or spread of the values of that variable. For dates, it may involve looking at the distribution over time. For all relevant columns we'll be asking: what does the distribution of values in this column look like, and is anything surprising?
An analysis like this is useful to generate new hypothesis or data insights, and should leave us with more questions than we had at the beginning. Those question will then be answered with a more in-depth review of the data.
Contents:
4.1) Players dataset
4.2) Clans dataset
4.3) Games dataset
4.4) Gameplayerstats datasetSummary and highlights:
Players
- In 2025, we got the least amount of new registrations since 2015.
- This seems to be part of a downward trend since the COVID peak of 2020.
- More than half of our player base was from the USA, Russia, or Germany in 2025.
- Few users ever rename (6.5%)
Clans
- The clan system is still actively used, and new clans are created every year.
- However, only a small part of the playerbase uses clans: about 3.2%.
- A large number of clans only has 1-3 players.
- The top 25 largest clans have 29-310 players.
Games
- In 2025, 1.68 million games were started. This is 10.2% fewer than 2024.
- At the peak, in 2022, 2.16 million games were started.
- Weekends, between 19:00 and 21:00, are the most busy.
- The median duration for games is about half an hour. 95% of all games end within 2 hours.
- The two most popular maps in the past 5 years were DualGap and Seton's Clutch.
Gameplayerstats
- In 2025, we have had the fewest total number of players since 2020.
- Most players play no more than 15 games before becoming inactive.
- A small percentage of the playerbase are responsible for nearly all games: 90% of the players have fewer than 144 games played.
- Half of all registered players leave within 4 days of their first game.
- The median global rating for non-churned and non-new players for the last 5 years is 757: players with a rating above 1500 are in the top ~3% of all players.
-
4.1 - Players
This chapter looks at the
Playersdataset. For a description of the data that makes up this dataset, see the data dictionary. Most of these graphs are part of the univariate anaylsis of this dataset. Simply put: we look at each piece of information about players on its own to understand how it is distributed and how common different values are. This includes things like how many accounts are active, when players registered, how often they changed their names, and other basic behaviors. The goal is to see general patterns, spot unusual cases, and get a clear picture of the player base.
This text was last updated on February 28, 2026.Fewer registered users than average in 2025
Question: Did we get a normal amount of registrations last year? Is FAF dead?
We got fewer than previous years, which isn't great.On average, we get 28900 new users each year, with a standard deviation of about 7600. The last year was under the average, but within the normal standard deviation, similar to 2023. The year 2024 stood out by its larger amount of registrations compared to 2022, 2023, and 2025. However, as explained below, this bump might almost entirely consist of accounts that never logged in. In general, there has been a decreasing number of new registrants since the large COVID peak in 2020. In fact, 2025 received the fewest registrants since 2015. If this trend continues for 2026, it may have significant effects on the playerbase, and could be an indication that more efforts should be taken to advertise and popularize the game.
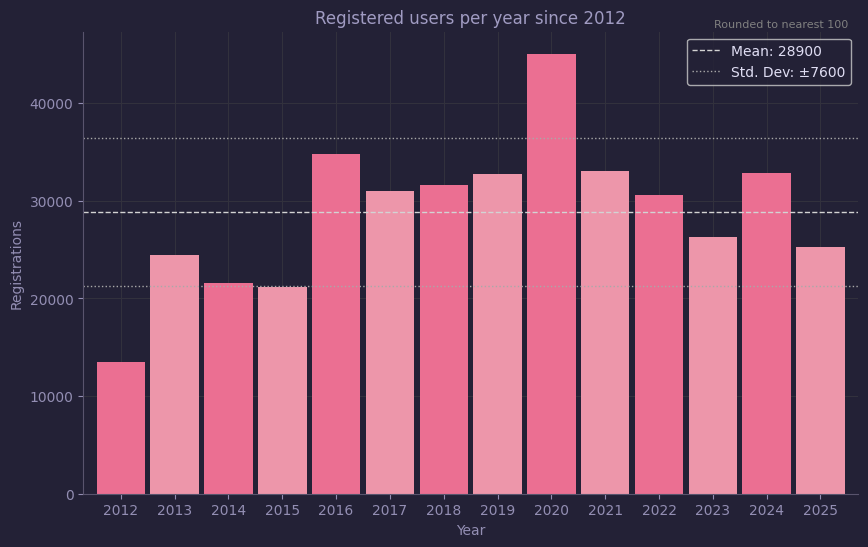
Fig. 1: 2025 saw the fewest registration in a decade.Cumulative growth of registered users
Question: When do we get our 500.000th player?
At this rate, early 2029.Unsurprisingly, we see an increase in registered users with each year. We've got our 400.000st users in November of 2025. If we keep gaining new registrations at the historic rate, we'll get our 500.000th user at the beginning of 2029.
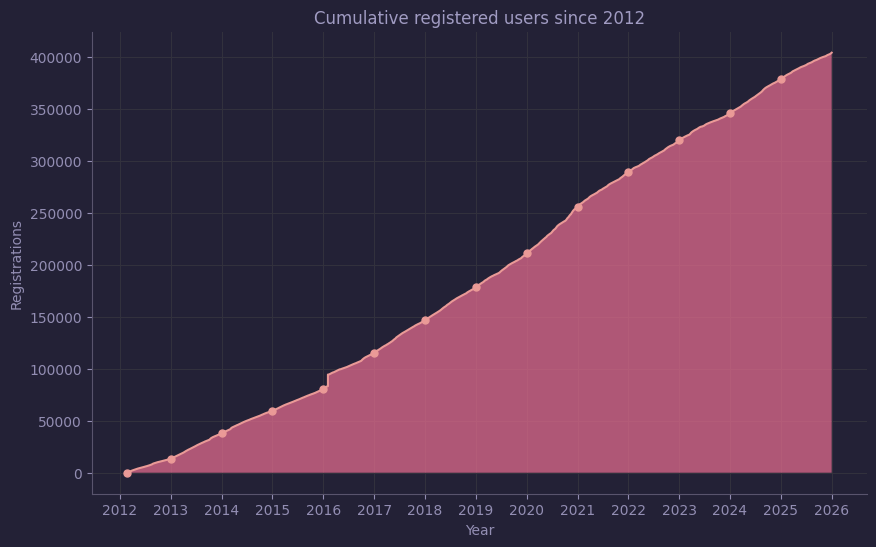
Fig. 2: In 2025, we reached more than 400.000 users.Average monthly registrations: overall vs 2025
Question: Are specific months more popular for registration, and does that differ for 2025 in comparison to all years?
January and February are usually more busy. 2025 was very quiet overall.As already shown in the 'Registered users per year' graph, 2025 saw fewer registrations than average. This is similarly reflected when the numbers are broken down by month. Only January and March were slightly above average. The average monthly new registrations is about 2414. For 2025, the number was 2105.
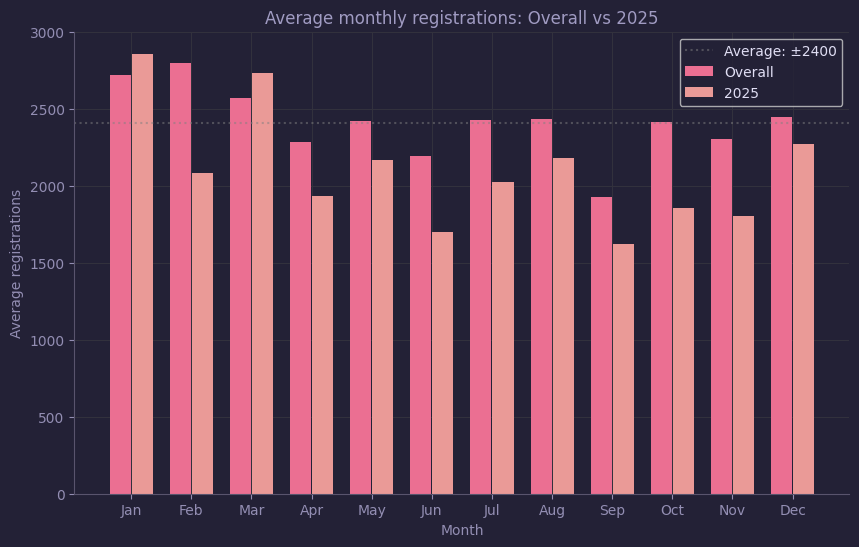
Fig. 3: In 2025, all but two months saw fewer than average monthly registrations.Heatmap of registration activity for the past 5 years
Question: Do specific days of the week see more registrations than average?
The weekends are most popular, though registration spikes with steamsales.This heatmap shows the amount of registrations for each day of the year, normalized for that year's average. Yellower colours indicate a higher than average number of registrations, while colors that are more purple indicate fewer registrations than average. There are a few high-activity zones visible, which correspond to the steam sales in March, November, and December. Especially the last 2 weeks of the year see more activity. There also seems to a recurring peak in May, though the cause of that is unclear.
Some data is missing in june of 2023 due to some problems we had with the database around that time.
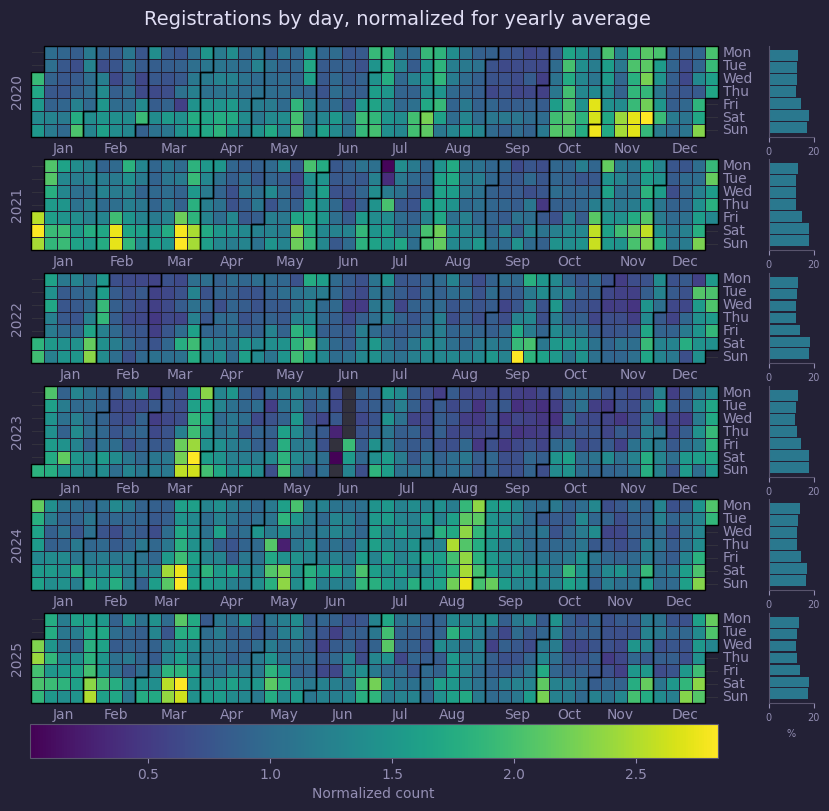
Fig. 4: The weekends see more registrations than other days of the week.A large portion of new users never logged in
Question: Is it common for people to register an account but never use it?
Yes, about 1/4th to 1/3rd of users never actually play.As previously shown in the FAF statistics Megathread #2 from back in 2025, a significant portion of registered users never actually logged in. In 2024, this group was as large as a third. This might explain in large part the seemingly large number of registrants in 2024. In fact, if we only look at the number of accounts that logged in at least once after registering, we see a noticeable and worrying downward trend in the number of users.
In 2025, 24% of registered users did not log in once. Putting the data from 2024 and 2025 in context is difficult, as data from before 2019 is almost entirely missing, probably due to some cleanup or database related event by the administrators. Similarly, data from before 2024 seems to have been wiped clean. This is disappointing, as data from previous years might have been compared to 2024 to test whether or not the large number of inactive registrants in 2024 was significant or could be considered normal.
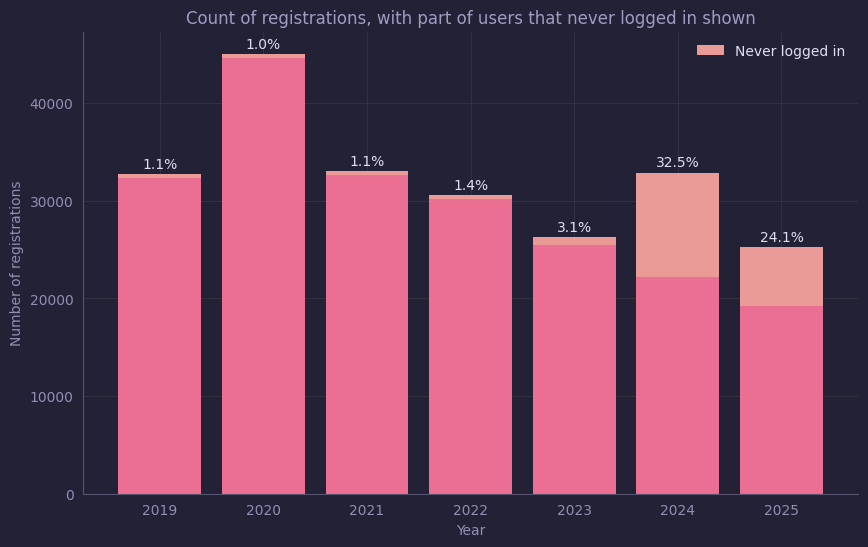
Fig. 4: A large portion of users never logged in once after registering. The large number of registrations in 2024 might be completely a consequence of such 'empty' accounts.A few facts about usernames
Question: What's the shortest username? What's the longest?
Shortest: one letter. Longest: 20 letters.The shortest usernames, of which there are 15, are one letter. They are: Q", "X", "E", "V", "A", "M", "L", "b", "R", "N", "G", "D", "s", "J" and "f". Most of these accounts were registered between 2012 and 2014, and none of these accounts have been active in recent years.
The record for the longest username belongs to "Major_jok_is_Awesome", with a total of 20 letters.
Number of players by country as derived from ip
Question: Where do all our players come from?
Mostly the USA, Russia, and Germany.FAF records the last IP address a player connected with. The location of our users can be estimated based on this IP. The graph below shows the total number of users that have an IP adress that can be traced back to a specific country. We can see that a large number of players comes from the USA, Russia, and Germany. In fact, these three countries together are responsible for more than half of our playersbase.
Translating IP to countries is not an exact science, and so these numbers do not entirely reflect reality. Players connecting with VPNs will be counted as a player from that country, for example. We also know that in the past there were several malicious actors who registered more than one, in some cases upward of 50, accounts, which similarly throws off the conclusions some. I've corrected for this to some extent by only looking at IPs that were connected to at most 5 accounts.
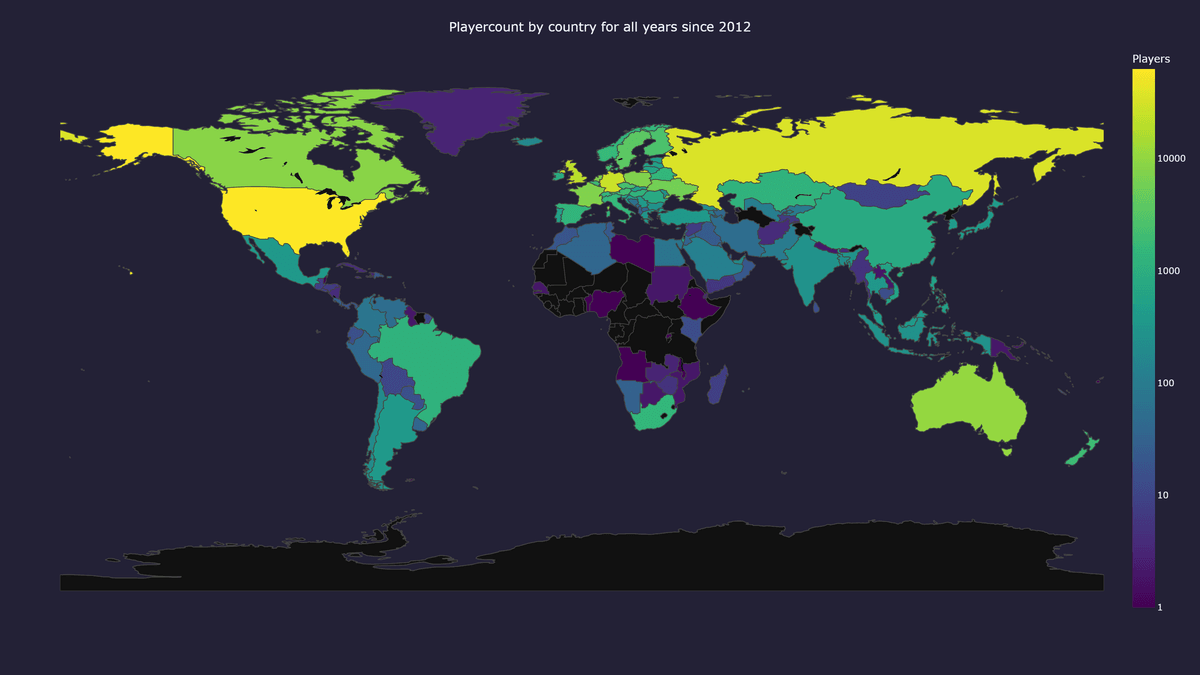
Fig. 5: More than half of the playerbase comes from the USA, Russia, or Germany.Number of players by country as derived from ip, 2025 only
Question: How has the player count by country in 2025 changed in comparison to previous years
Not much, but many countries that already had few players are now completely empty.The data for only the year 2025 is not very different from the overal data. Some countries with low playercounts no longer have any active players, such as various country in Afrika: Sudan, Ethiopia, Nigeria, Libya. Other countriese have seen a decrease, but continued to have active players. The percentage of players from the US and Russia have slightly increased, though this is likely a consequence of fewer countries having any players proportionally.
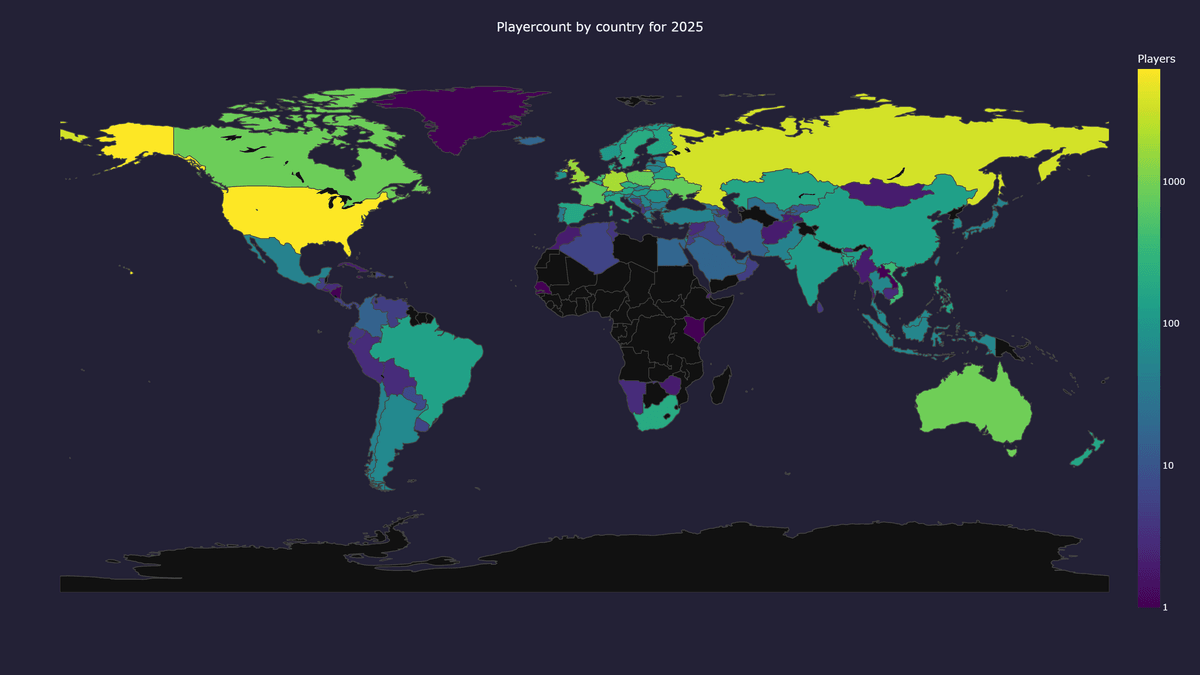
Fig. 6: In 2025 the origin of players was similar compared to other yearsTable of top 25 countries by playercount
The table shows the ranking of the top 25 countries by user count, for both all years on record and 2025 specifically. The United States (USA) leads by a wide margin with 62,785 users, nearly double the number from Russia (RUS) in second place at 34,398. Germany (DEU) and Great Britain (GBR) follow with 26,331 and 20,007 users, respectively.
The distribution shows a sharp drop after the top few countries, with counts decreasing to just over 1,000 for the 25th-ranked Brazil (BRA). Most of the top 25 are European countries, with Australia (AUS), Canada (CAN), New Zealand (NZL), and South Africa (ZAF) representing other regions.
Table: Top 25 countries by playercount, for all years and for 2025
ranking_all country_all count_all percent_all country_2025 count_2025 percent_2025 1 USA 62785 28.7% USA 6206 30.2% 2 RUS 34398 15.7% RUS 3546 17.2% 3 DEU 26331 12.1% DEU 1963 9.5% 4 GBR 20007 9.2% GBR 1596 7.8% 5 AUS 10372 4.7% AUS 906 4.4% 6 CAN 8633 4.0% CAN 859 4.2% 7 FRA 7523 3.4% UKR 748 3.6% 8 POL 7360 3.4% POL 731 3.6% 9 NLD 6952 3.2% FRA 628 3.1% 10 UKR 5958 2.7% NLD 484 2.4% 11 SWE 3480 1.6% VNM 388 1.9% 12 FIN 2584 1.2% CZE 242 1.2% 13 CZE 2273 1.0% ZAF 201 1.0% 14 DNK 2215 1.0% SWE 201 1.0% 15 AUT 2153 1.0% BGD 192 0.9% 16 BEL 1963 0.9% ESP 178 0.9% 17 NZL 1846 0.8% FIN 176 0.9% 18 NOR 1652 0.8% NZL 175 0.9% 19 ITA 1628 0.7% AUT 171 0.8% 20 BLR 1529 0.7% DNK 171 0.8% 21 CHE 1503 0.7% BEL 166 0.8% 22 ZAF 1485 0.7% KAZ 165 0.8% 23 ESP 1378 0.6% ITA 165 0.8% 24 KAZ 1238 0.6% BLR 159 0.8% 25 BRA 1171 0.5% PHL 144 0.7% Percentage of users that have renamed at least once, grouped by year of account creation
Question: What percentage of players, grouped by their account creation year, has ever changed their username?
On average 6.5%.Only a small fraction of users have ever changed their account names. Older accounts naturally have had more time to change their names, and the users who remain active from those early years are likely the ones most interested in customizing their accounts. In contrast, users who registered more recently, such as in 2024 or 2025, seem to have had less opportunity or motivation to rename their accounts yet. Overall, 6.5% of all users have ever changed their account name, indicating that while renaming is possible, it is relatively uncommon to change usernames.
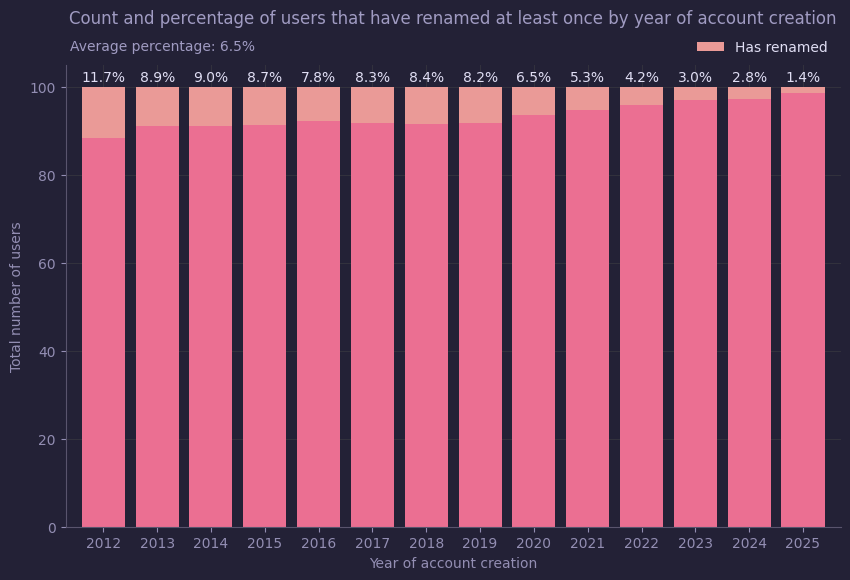
Fig. 7: Only 6.5% of all players have renamed their account at least once.A few prolific renamers
Question: What does the distribution of the number of renames look like, and are there any extremes?
Most people never rename. A few people rename very often.This data shows the users who have changed their account names the most times. At the top of the list, there are users who have renamed their accounts dozens of times, with the highest recorded at 85 changes. Some of these accounts are still active, logging in as recently as early 2026, while others do not have a recorded last login. Overall, the distribution of rename counts is extremely skewed: the vast majority of users have changed their names only a few times or not at all, while a very small number of users have changed their names tens of times. This indicates that frequent renaming is unusual and concentrated among a handful of highly active or particularly engaged users, whereas most accounts remain with their original or minimally modified names.
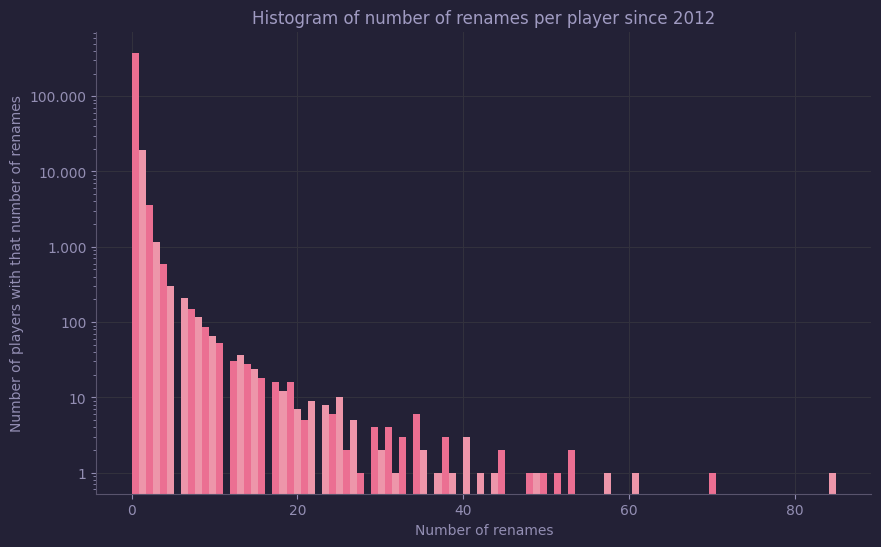
Fig. 8: Most people never rename, but a few players rename very often. The most renames counted for one player was 85.Table: List of users who have renamed their account more than 40 times.
Username Number of renames Shurayukihime 85 ylllij7xli9llil 70 Bolmagasa 61 trandan 57 Hue-Janus 53 GheyGorton 53 MeatyOwlLegs 51 Lmaous 50 Gently- 49 Nepalm 48 Dead_Six 45 Fremy_Speeddraw 45 Unpwnable 44 nothaFreeZone 42 -
4.2 - Clans
This chapter looks at the
clansdataset. For a description of the data that makes up this dataset, see the data dictionary. For some graphs, some activity data was pulled from theplayersdataset. As such, not all these graphs are strictly a univariate analysis. We'll survive.
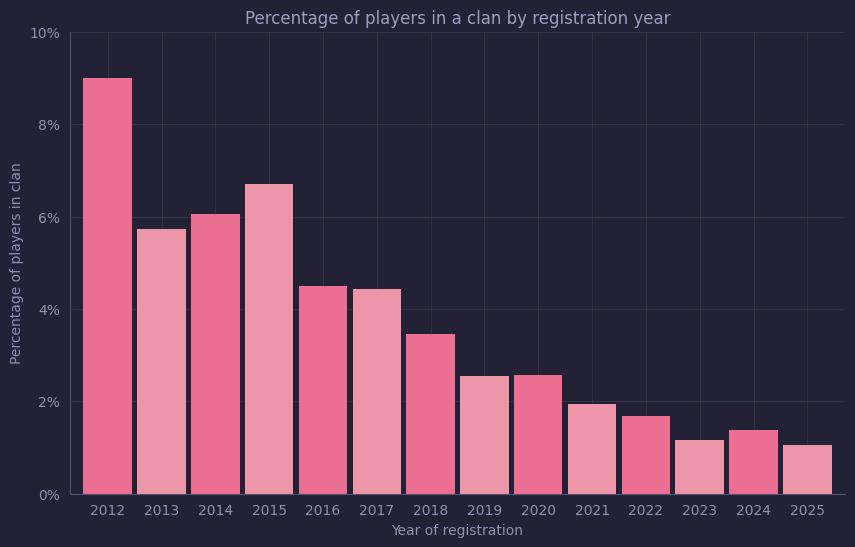
This text was last updated on March 01, 2026.Percentage of players in a clan by year of registration
Question: Are many people part of a clan, and does the age of the account matter?
Only a small portion of all players are in a clan. Older accounts are more likely to have joined one.This graph shows the percentage of the users who are in a clan, split over the year in which they registered their account. Perhaps unexpectedly, a larger part of old accounts are in a clan than younger accounts. On average, 3.2% of players are part of a clan.

Fig. 1: Only 3.2% of the playerbase uses the clan system.Clans created throughout the years
Question: Is the clan system still actively used, and are any of the old clans still alive?
Yes, new clans continue to be made. A surprisingly large portion of old clans are still active.This graph shows both the date at which a clan was created, and whether or not the clan has any active members. An active member was defined as any clanmember that had logged in at least once in 2025. In total, 2805 clans were created since 2014.
Noteworthy is the fact that there are a number of clans that continue to have active members since their creation in 2012. Another thing of note is the large bump of now-dead clans created around the summer/fall of 2024, for which I have no explanation.
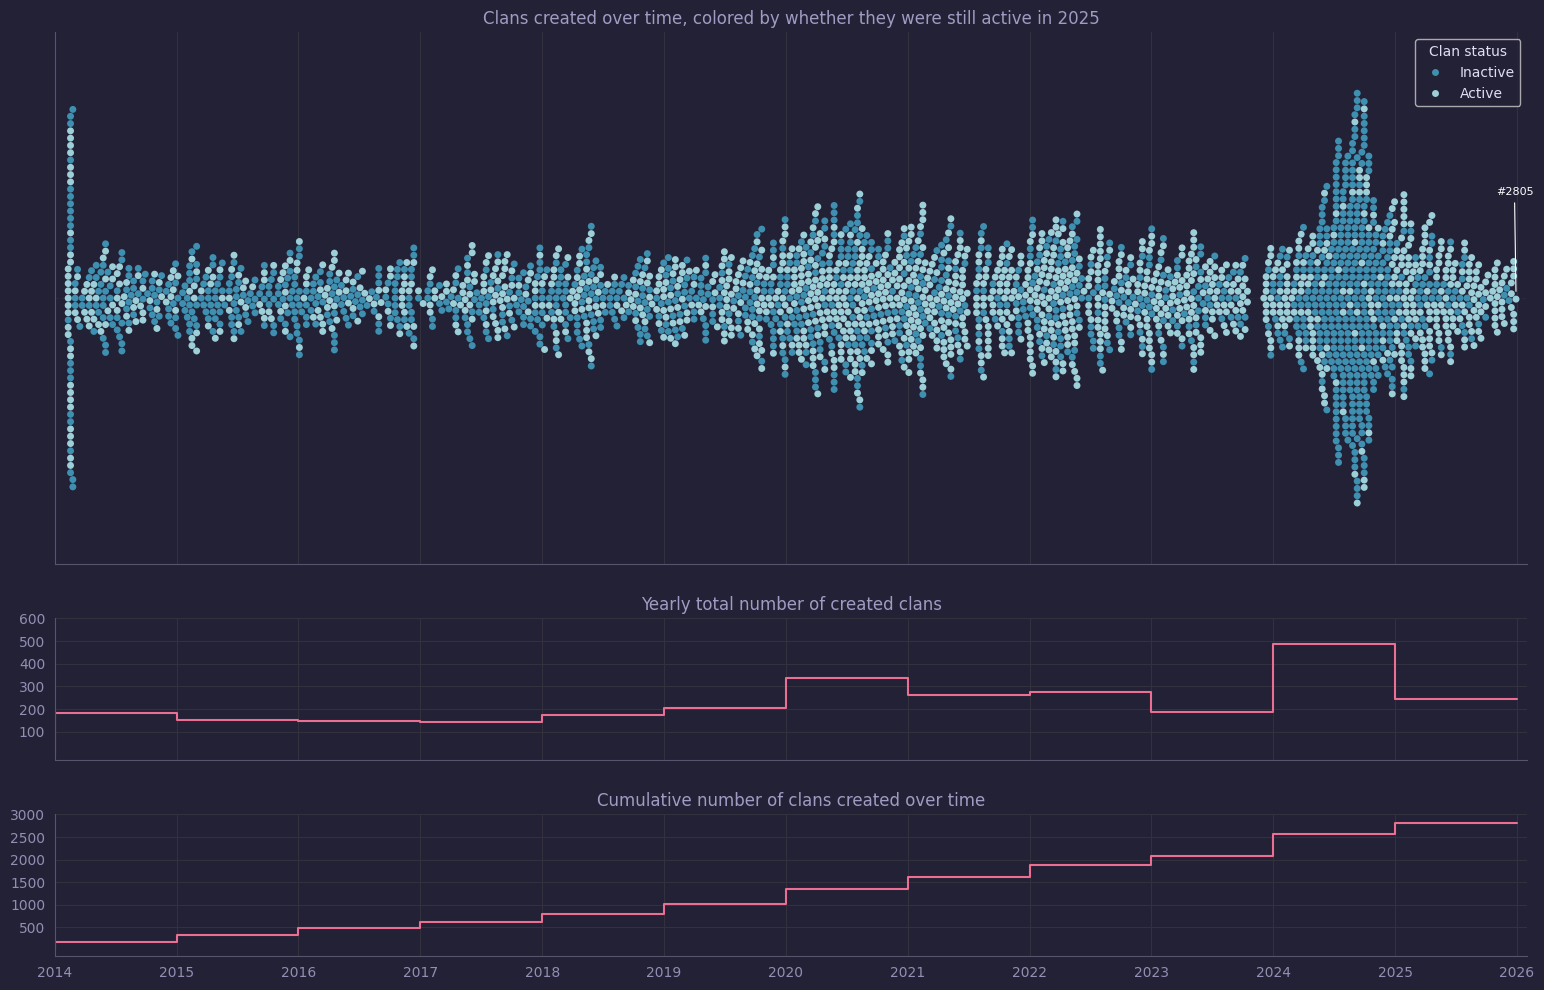
Fig. 2: Clans continue to be created. A surprisingly large portion of old clans are still active.Top 25 clans by size as of 2025
Question: What are the largest clans, and how many players of those clans are still active?
ANZ is the largest, with just over half of their members active in 2025.For this graph, the clans were ranked by number of members, and the percentage of active and inactive members calculated. Most clans have a fair number of inactive members, likely corresponding with the age of the clan. The Australian clan ANZ is the largest clan, with 310 members of which 56.1% were active in 2025. The clan DPG has the highest percent active members in the top 25 clans: 97.4% of their members were active in 2025.
Given that there is a decent number of large and still active clans, organizing a clan-based tournament with the top 10 or 20 clans might be an interesting idea.
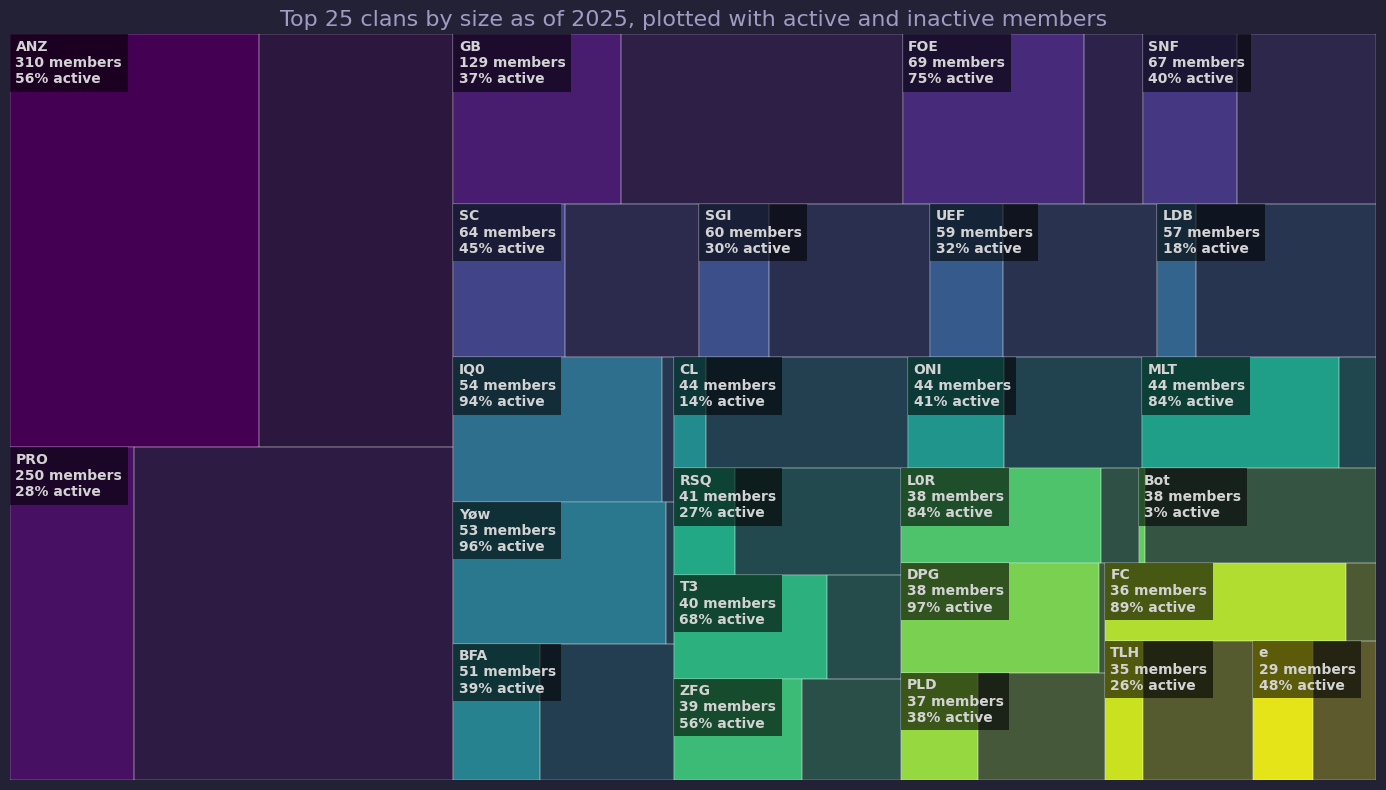
Fig. 3: The Australian clan ANZ is the largest clan by far, with 310 members. Just over half of the members of that clan are still active.Distribution of number of players per clan
Question: How large are clans usually?
Almost all clans have 3 or fewer members, though a handful have hundreds.In this histogram, it is clearly visible that most of the clans only have one or two members. It might be that these clans were created for the stylistic benefit of having a clan tag in front of the username.
Not shown on this graph were the top 5 largest clans, to make the graph readable.
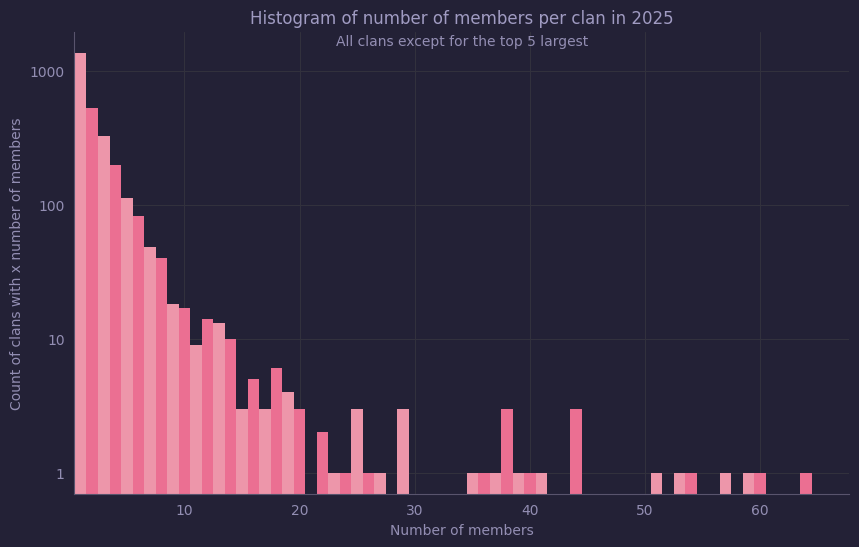
Fig. 4: The vast majority of clans only have one or two players. -
4.3 - Games
This chapter looks at the Games dataset, showing mostly univariate analyses. For a description of the data that makes up this dataset, see the data dictionary. Each entry in the dataset reflects one game that was played. The ID for each entry in this dataset is what we commonly refer to as the replayID
In this chapter we'll explore how many games are started each year, month, day, and hour. These graphs give us another look at activity over various time periods. We also briefly look at the differences between game duration measured by 'real time' and 'replay time', which often differ, then look how long games usually last.
Some of the other variables in this dataset are also briefly explored, such as the 'game validity' and 'victory condition' variables. Lastly, I've made a plot showing the top 5 most popular maps for the years since 2020. Surprise surprise: DualGap is very popular.
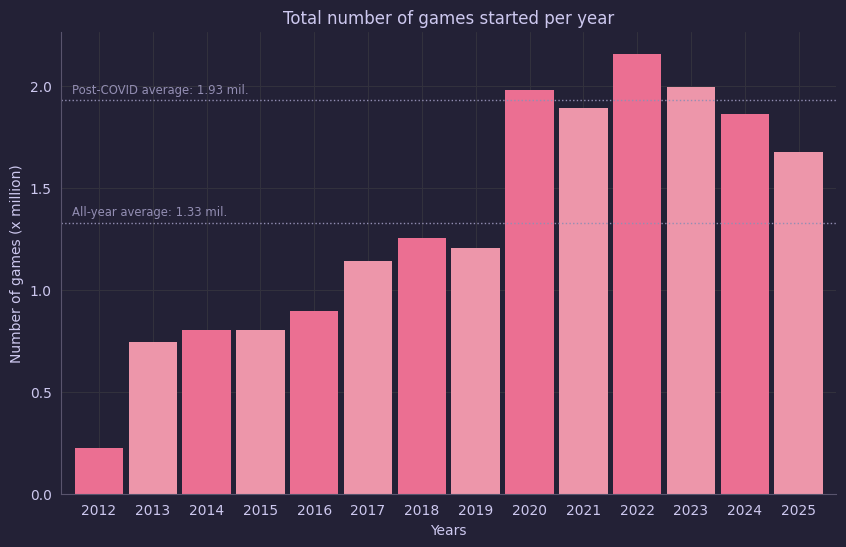
This text was last updated on March 11, 2026.Number of games started per year
Question: How many games are created each year?
On average 1,330,000.0, though there is a large difference between the years before and after the COVID year of 2020.This graph shows the total number of games started per year. This includes all games that were launched: global games, ladder games, co-op games, without regard for game quality or length. Numbers shown are in millions: since the start of the project until the end of 2025, a total of 18.65 million games were started. This comes out to an average 1.33 million games per year. In 2025 specifically, 1.68 million games were started.
The COVID year of 2020 resulted in the largest ever increase in our playerbase. Consequently, in 2020 and subsequent years many more games were created than in the previous years. The average for the period between the start of 2020 to the end of 2025 was correspondingly higher: 1.93 million instead of 1.68 million games. The peak year of 2022 saw 2.16 million games that year. In comparison to this peak, 2025 saw 0.48 million fewer games started (-22.2%). Compared to 2024, 2025 saw 0.19 million fewer games started (-10.2%). It is clear that the number of games created has been steadily decreasing since our COVID peak year.

Fig. 1: A total of 1.68 million games were started in 2025.Number of games created by month
Question: Were more games created in some months than others?
It looks like the beginning of the year saw more games than the end of 2025.Because the post-COVID years are so different from the pre-COVID, the graph below plots only the data for the post-COVID years. Specifically, the graph shows the average number of games created by month for the year 2020 up to and including 2024, and compares them to the number of games created per month in 2025.
The graph shows how the created number of games per month in 2025 was less than the average for the post-COVID years. In 2020–2024, an average of 164,930 were created per month, while in 2025 139,890 games were created. This is a decrease of 15.2%. Compared to 2024, the average number of games per month has also decreased (by 15,600, or -10.0%). As with the previous graph, this number includes all games that were launched, without regard for game quality or length.
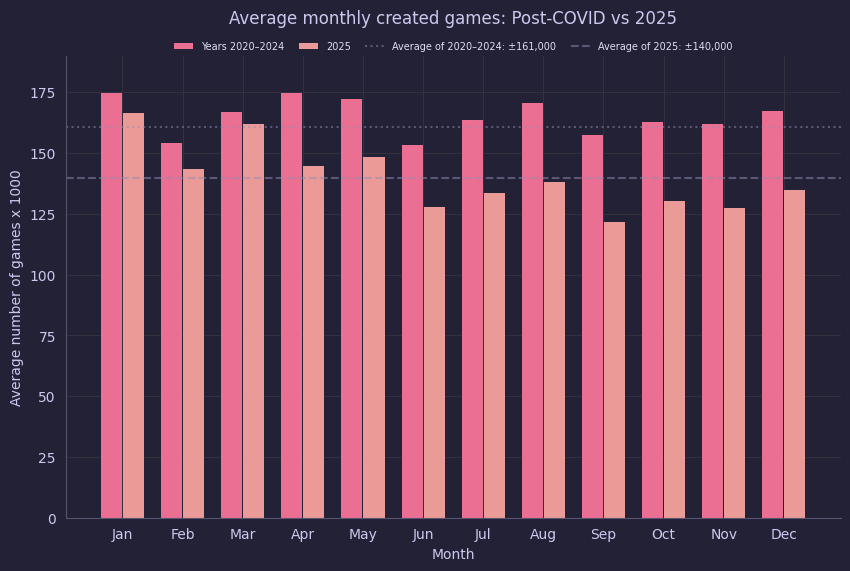
Fig. 2: More games were played in the winter period in 2025 than in any other months.Games created per day
Question: What days of the week see the most number of games created?
Weekends are most popular, as expected.This graph shows the number of games created per day per year. The values shown are normalized for each year's average: green/yellow values mark days with a higher-than-average number of games started ont that day, while purple/blue marks the opposite.
For easy comparison between weekdays, barcharts on the right side show the percentage of total games in that year for that day of the week. Clearly visible are the higher intensity on the weekends. Meanwhile, Wednesdays and Tuesdays are the least busy.
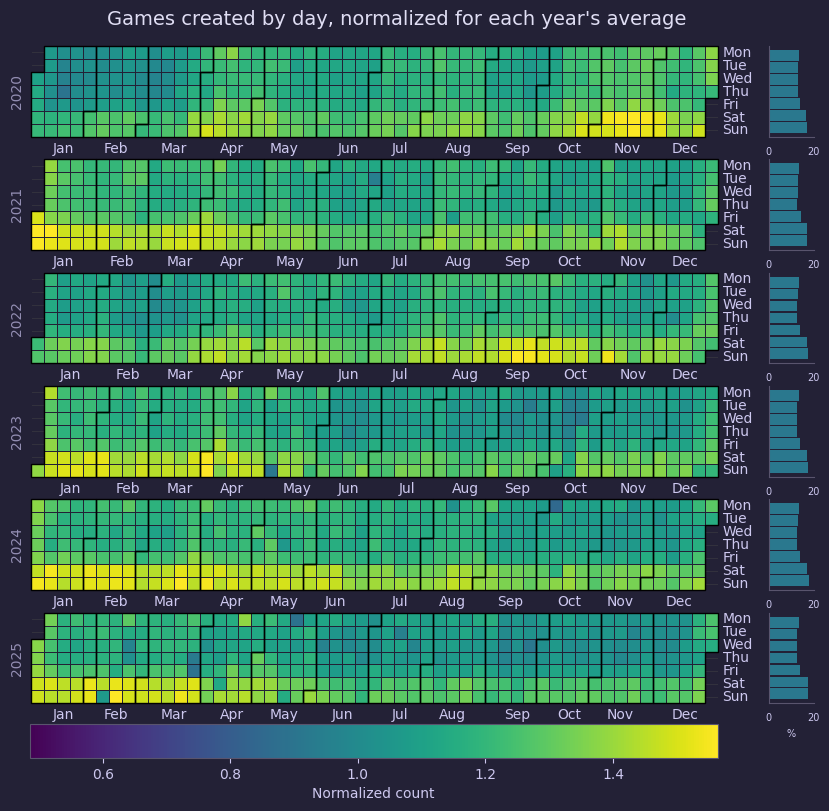
Fig. 3: Number of games per day compared to average. Weekends are clearly busier.Relative number of games per weekday per hour
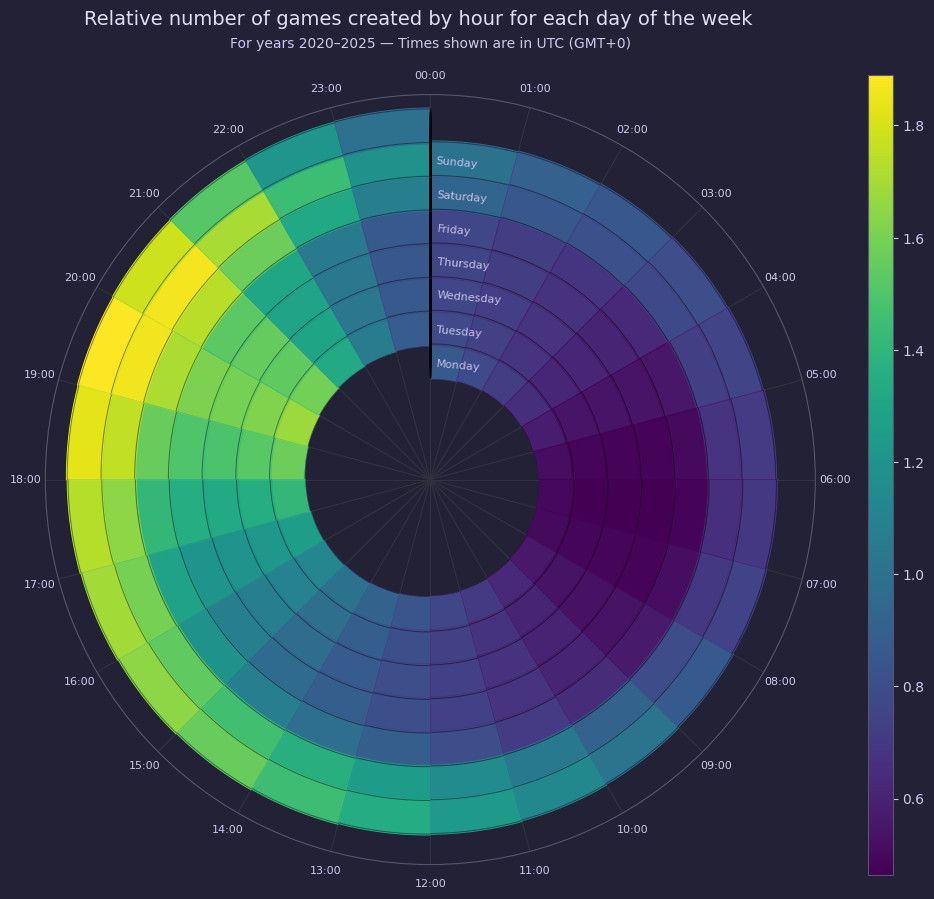
Question: What hours of the day are most busy?
Saturdays, between 19:00 and 21:00 UTC (GMT+0)Similarly to the calendar plot above, this spiral heatmap plot shows the average number of games for each day of the week for the years 2020–2025. In contrast to that previous plot however, this plot goes a layer deeper and shows the average activity for each weekday by hour. Each ring of the spiral is one weekday, spiraling outwards from Monday to Sunday.
It's immediately clear that there is a distinct separation between weekdays and weekends, as also shown by the plots above. It continues to show the variability within each day: more games are started in the evenings, with the peak activity for each day being between 19:00–21:00. All times plotted on this graph are shown as Constant Universal Time (UTC), which corresponds to GMT+0 (Greenwich Time).

Fig. 4: Relative number of games per weekday per hour. Peak activity on saturdays, between 19:00 and 21:00.Game durations: real time vs replay time
Question: How long do games usually last?
Thats depends on how you measure it, which is more complex than it would seem at first glance. However, we can say that roughly 50% of all games end within half an hour, 75% within an hour, and 99% within 3 hours.There are two ways to express how long a game lasted. The first option is to subtract the recorded startTime from the endTime, which we'll call 'real time'. However, sometimes the recorded data is corrupted in one way or another. Some endTime datapoints are identical to their startTime, which would mean a game has a duration of 0. Another way for the data to be corrupted is when the endTime is recorded several hours after the startTime. It may ofcourse be that both these values are genuine: a game might have closed exactly as it tried to open, or a game might actually have lasted more than five hours. However, in nearly all cases this instead means that the data somehow got corrupted.
Instead of using 'real time', we can also look at it in a second way: by the number of replayTicks. We will call this option 'replay time'. It's based on the fact that replay ticks are a unit of time equivalent to 0.1 second, as long as the simulation isn't slowed down. For correctly recorded games without any speed modifiers, the two durations should be identical or at least very similar. There are a few situations in which we can expect these values to differ, but not by too much.
To understand the data, we first need to understand what the data looks like. The graph below helps in that regards: it plots a histogram of the number of games for both durations of time. The two distributions are plotted so they overlap. In the ideal case, were all data was correct, this would result in both distributions to be identical. However, this graph shows that for each duration, there are more games with that duration in 'real time' than in 'replay time'. This implies that for many games the 'real time' duration for many games is larger than the 'replay time' duration.
The large spike of games with a 'replay time' of near zero seems a likely culprit for this difference. In reality, we also in general expect that 'real time' is higher than 'replay time', because games might run at slower simulation speed. This causes each tick to take more than 100ms to execute. The graphs below will look at this difference in more detail.
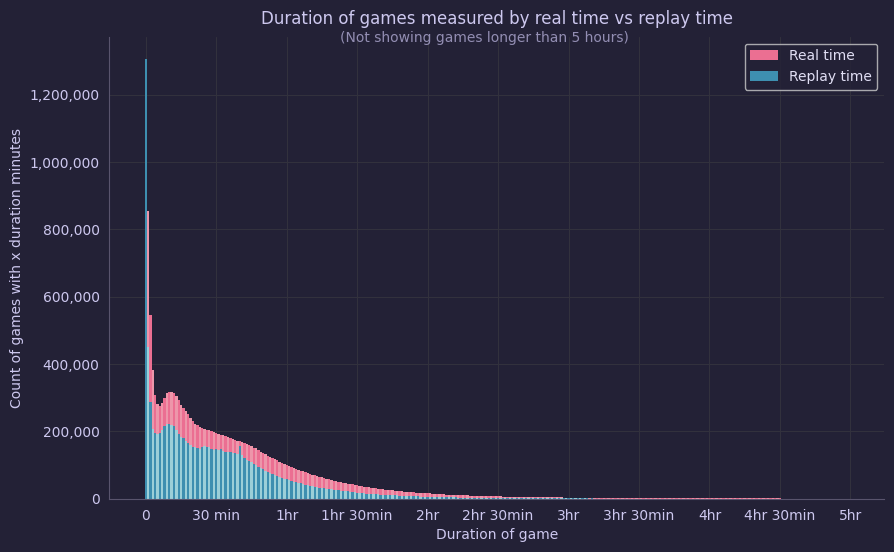
Fig. 5: Overlapping plots of duration as measured by subtracting starTime from endTime, and based on the replayTick amount.We can plot the 'real time' duration against the 'replay time' duration for each game, which gives us the figure below. The data shown in this plot has already been somewhat cleaned: all games that have a duration of 0 for either 'real time' or 'replay time' were removed. The plot also only shows a random selection of 10% of the datapoints, and only the games that were shorter than 240 minutes (4 hours).
The expected linear relationship between both types of durations is clearly visible: there is a straight diagonal line formed by the games that have an identical or similar duration for both 'real' and 'replay' time. However, there are also a number of games that show up far removed from this ideal diagonal line.
Most such games (93.39%) show up below the diagonal line:, implying that for a given duration in real time, the duration in 'replay time' was lower. These are the games that slowed down and ran at lower simulation speeds. The games above the line are fewer(6.61%), but all the more mysterious: their location imply that the simulation was played at a higher than normal speed, which is not typical for normal games.
Also visible are a few faint diagonal lines in the upper half of the graph. These lines might imply that some games are played at specific factors of increased speed, such as 1.1x or 1.5x faster than normal.
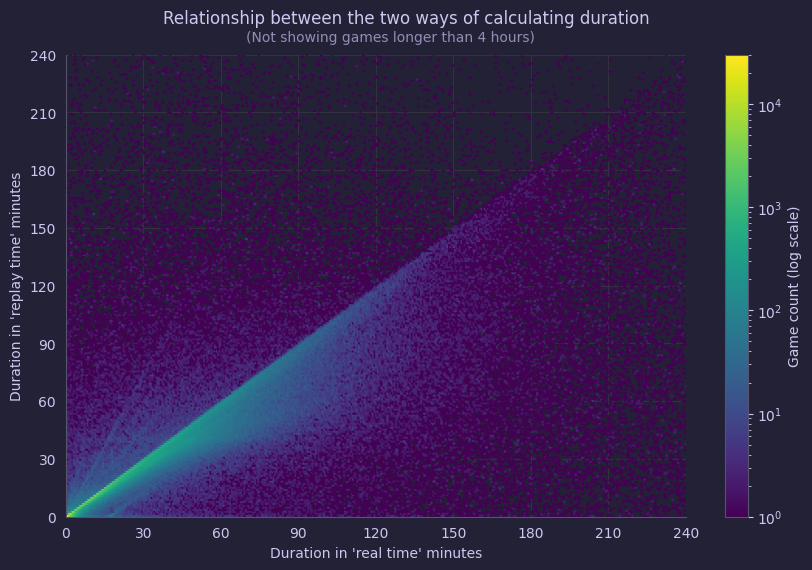
Fig. 6: Real time duration plotted against replay time duration.When trying to work out how games usually last, the data should be cleaned so that game records that are likely corrupted in some way are removed. To work with this dataset, I've chosen to exclude the top 0.375% outliers for both durations. As shown in the table below, the maximum 'real time' duration of 99.6% of the datapoints is almost 300 minutes, or roughly 5 hours. The maximum 'replay time' for this data is almost 190 minutes, or 3 hours and 10 minutes. Likely this cut-off already includes some games that were corrupted, but as it excludes the most egregious outliers that doesn't entirely matter.
This table also shows that the minimum duration is 0.02 minutes. To remove any games that were closed before they could really begin, I've also chosen to remove any game that's shorter than 3 minutes from the cleaned dataset.
Table: Statistics for game duration on raw data
real_time_minutes replay_time_minutes count 11626199.0 11626199.0 mean 39.1 50.6 std 61.7 11515.3 min 0.0 0.0 25% 9.2 7.8 50% 27.0 23.5 75% 53.2 44.0 90% 85.3 68.3 95% 112.0 87.6 97% 134.5 102.7 99% 199.9 140.7 99.6% 300.4 191.7 max 29847.3 7158200.3 The cleaned dataset now includes 85.20% of all the records. Most of the removed records are the games that were shorter than 3 minutes: 85.91%. Looking at the data of this cleaner dataset, a few things can be said about the duration in 'real time'. First, there are a some really short games, and 25% of all the games are over within the first 15 minutes. The median is at 33 minutes, which means that half of all games end within that time. All but 3% of the games are over within 2 hours, and games longer than that are very rare.
Table: Statistics for game duration with most outliers removed
real_time_minutes replay_time_minutes count 9905964.0 9905964.0 mean 42.6 34.6 std 37.2 27.9 min 3.0 0.0 25% 15.4 13.3 50% 33.2 28.6 75% 57.7 47.3 90% 88.8 71.1 95% 113.8 89.2 97% 133.6 102.6 99% 179.9 131.4 max 300.0 190.0 Plotting the games with a maximum duration of 3.0 hours of 'real time' shows the distribution well. There are two areas that stand out: the remaining big spike in the first few minutes, and another bump at around minute 12. The big spike at the beginning would be larger if the data was plotted before it was cleaned: a large number of games with a duration shorter than 3 minutes was removed. These games are likely games that were only opened to quickly test something or games that ended shortly after start because of connection issues. This will be looked at in greater detail later.
The 50%, 75%, 90%, and 99% values were marked on the graph. Most games end within one hour, though at the extreme end of the spectrum you have 1% of all games lasting longer than 150 minutes (2.5 hours).
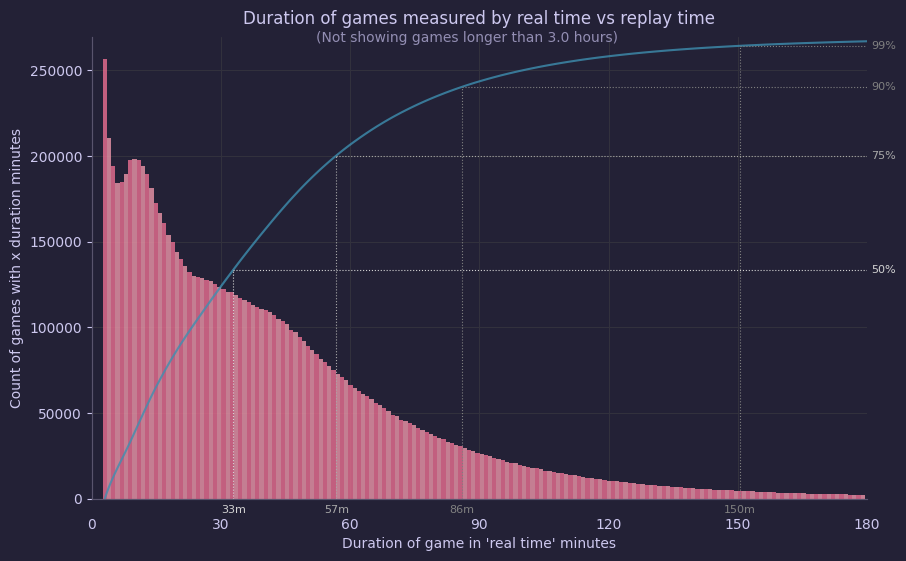
Fig. 7: Number of games by duration in 'real time'Most commonly recorded validity per year
Question: What kind of validity types are assigned to games?
Most commonly: 'UNKNOWN RESULT', 'BAD_MOD', and 'VALID'.Each game in the vault gets a 'validity' category, which is used to determine whether or not the game should be considered rated. This graph shows the top 5 most common categories per year.
For all years, the 'UNKNOWN RESULT' category is the most common. This value is likely assigned to the replay when the server did not get any other validity code and consequently does not know what to do with the game. Alternatively, it may happen when several players send conflicting validity states to the server, which receives validity states from each player and compares them. It might warrant some attention by the devs to investigate the cause of this, as this may indicate that about a third of all games are set to be unrated without a good reason.
The second most common category, 'BAD_MOD', indicates games with mods that made the game ineligible to be rated. We know from previously analysed data that PvP games is only a small segment of all games played on FAF, and modded (PvE) games are actually much more common than most PvP players assume. Consequently, 'BAD MOD' being the second largest validity group makes a lot of sense. The exact breakdown of number of games by type (PvP, PvE, Co-Op, etc) will be analysed later.
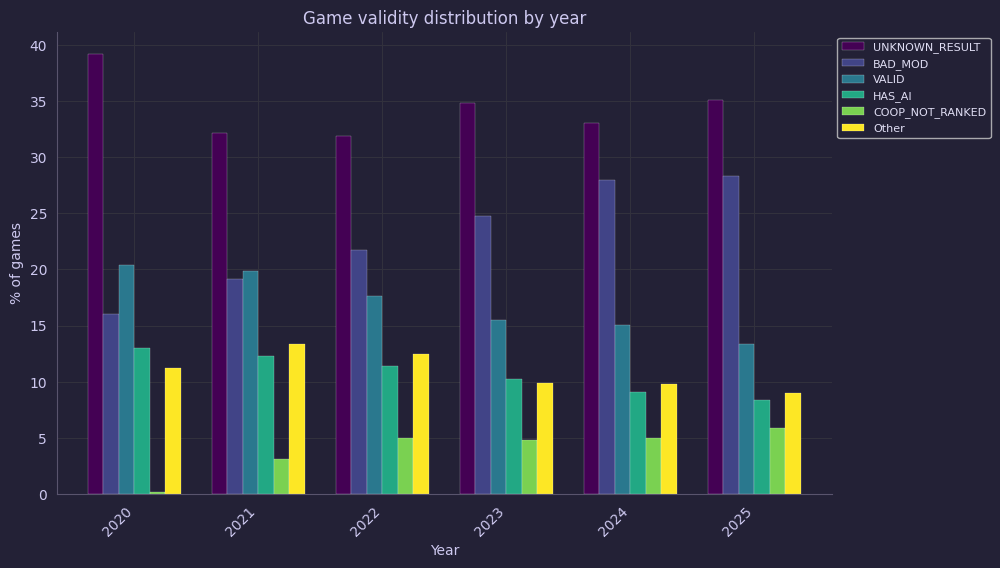
Fig. 8: Percentage of games for each year, split by validity category.Table: Validity categories, sorted by most common for 2025. Values are percentage of games with that validity category in that one year.
validity 2025 2024 2023 2022 2021 2020 COOP_NOT_RANKED 21.5 20.5 21.0 23.4 12.9 0.6 TOO_MANY_DESYNCS 19.8 15.9 16.6 18.9 16.2 12.6 EXPANSION_DISABLED 18.0 17.5 19.4 18.0 14.6 12.5 BAD_MOD 18.0 19.8 18.7 17.8 13.7 12.0 WRONG_DIFFICULTY 17.5 17.8 19.0 22.3 18.2 5.2 UNRANKED_BY_HOST 17.4 19.8 18.4 43.7 0.6 nan CHEATS_ENABLED 16.2 17.1 18.4 22.9 16.4 9.0 UNKNOWN_RESULT 14.8 15.5 17.5 17.3 15.3 19.6 VALID 11.4 14.2 15.7 19.2 19.0 20.5 TOO_SHORT 11.3 15.2 16.0 18.9 20.2 18.4 HAS_AI 11.2 13.6 16.3 19.7 18.6 20.6 TEAMS_UNLOCKED 9.3 8.3 11.0 18.3 23.3 29.8 NORUSH_ENABLED 8.4 8.8 10.3 24.4 18.8 29.3 MULTIPLE_TEAMS 7.5 10.4 13.5 19.8 22.9 26.0 BAD_UNIT_RESTRICTIONS 6.3 8.6 10.8 16.3 27.9 30.1 BAD_MAP 6.0 6.9 9.5 15.2 29.0 33.4 WRONG_VICTORY_CONDITION 5.7 5.7 8.7 19.4 26.3 34.1 PREBUILT_ENABLED 4.5 5.1 6.4 19.9 28.0 36.1 FFA_NOT_RANKED 3.6 17.7 17.1 24.7 20.8 16.1 UNEVEN_TEAMS_NOT_RANKED 3.6 3.6 4.4 22.5 31.9 34.0 NO_FOG_OF_WAR 3.6 4.8 6.4 19.0 27.6 38.6 SINGLE_PLAYER 2.2 1.4 nan nan nan 96.4 Victory condition distribution by year
Question: What victory condition is most common?
Demoralization remains the most common, followed by sandbox. A new game mode was added in 2025: 'Decapitation', but it has not become very popular yet.Games can be hosted with different victory conditions. The most popular mode has been 'Demoralization', which is the default 'Kill the commander to get a player out of the game' game mode. The 'Sandbox' mode doesn't have an actual end, and is usually used to test specific features or just play against the AI. In 2025, the 'Decapitation' mode was added. This game mode requires all commanders of a team to be killed to gain victory, but killing a commander does not remove that player from the game. They continue to play until all commanders are gone.
The distributions of these game modes are relatively stable, with 'Demoralization's slight decline being the only notable trend.
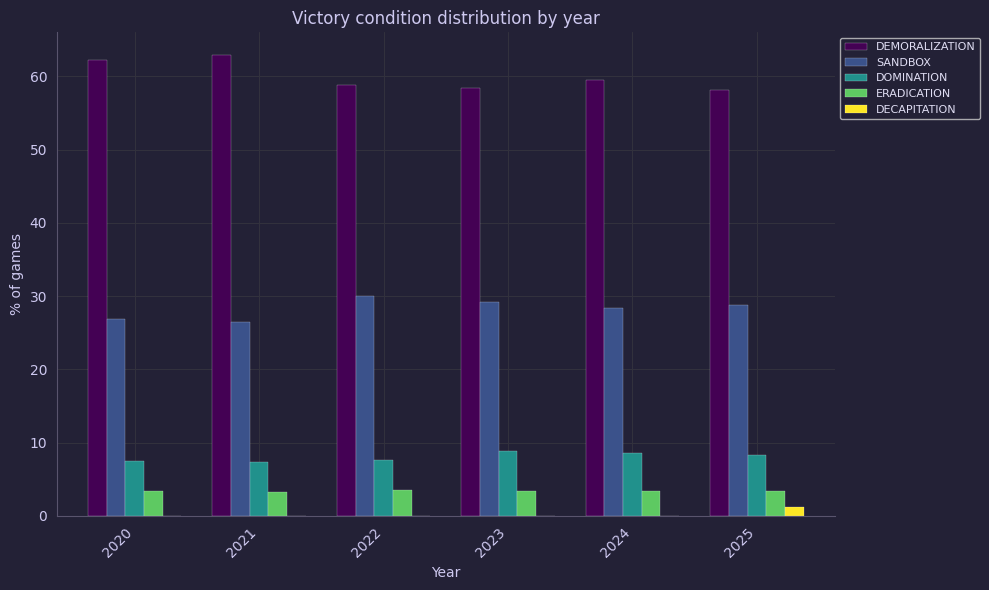
Fig. 9: Victory condition distribution by yearTop 5 most popular maps by year
Question: Which maps were most popular in the last few years?
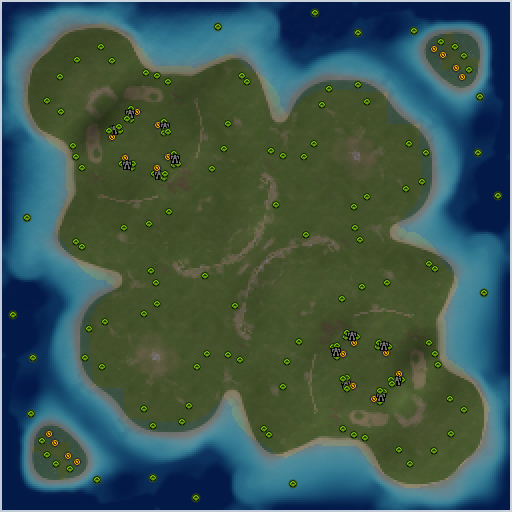
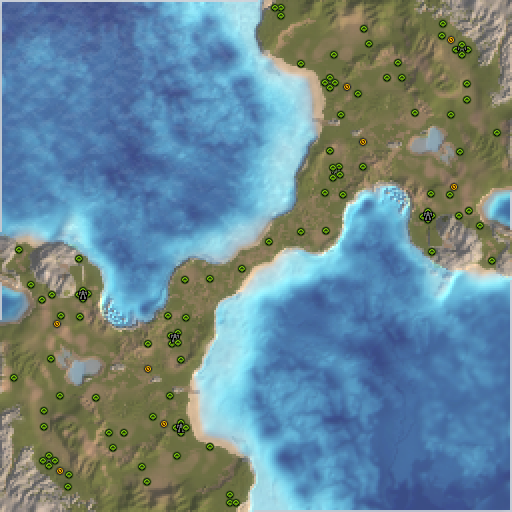
The most popular map in 2025 was DualGap Adaptive, though in some previous years it was Seton's Clutch instead.This plot shows the top 5 most played maps by year. Possibly to little surprise, 'DualGap Adaptive' and 'Seton's Clutch' are by far the most played, with 122,412 (1.4%) and 72,981 (0.8%) of games played respectively.
In 2023, Dualgap is shown twice: sometime this year the map was updated, and most of the playerbase started using the newer versions. From 2024 onward, the old version is no longer in the top 5.
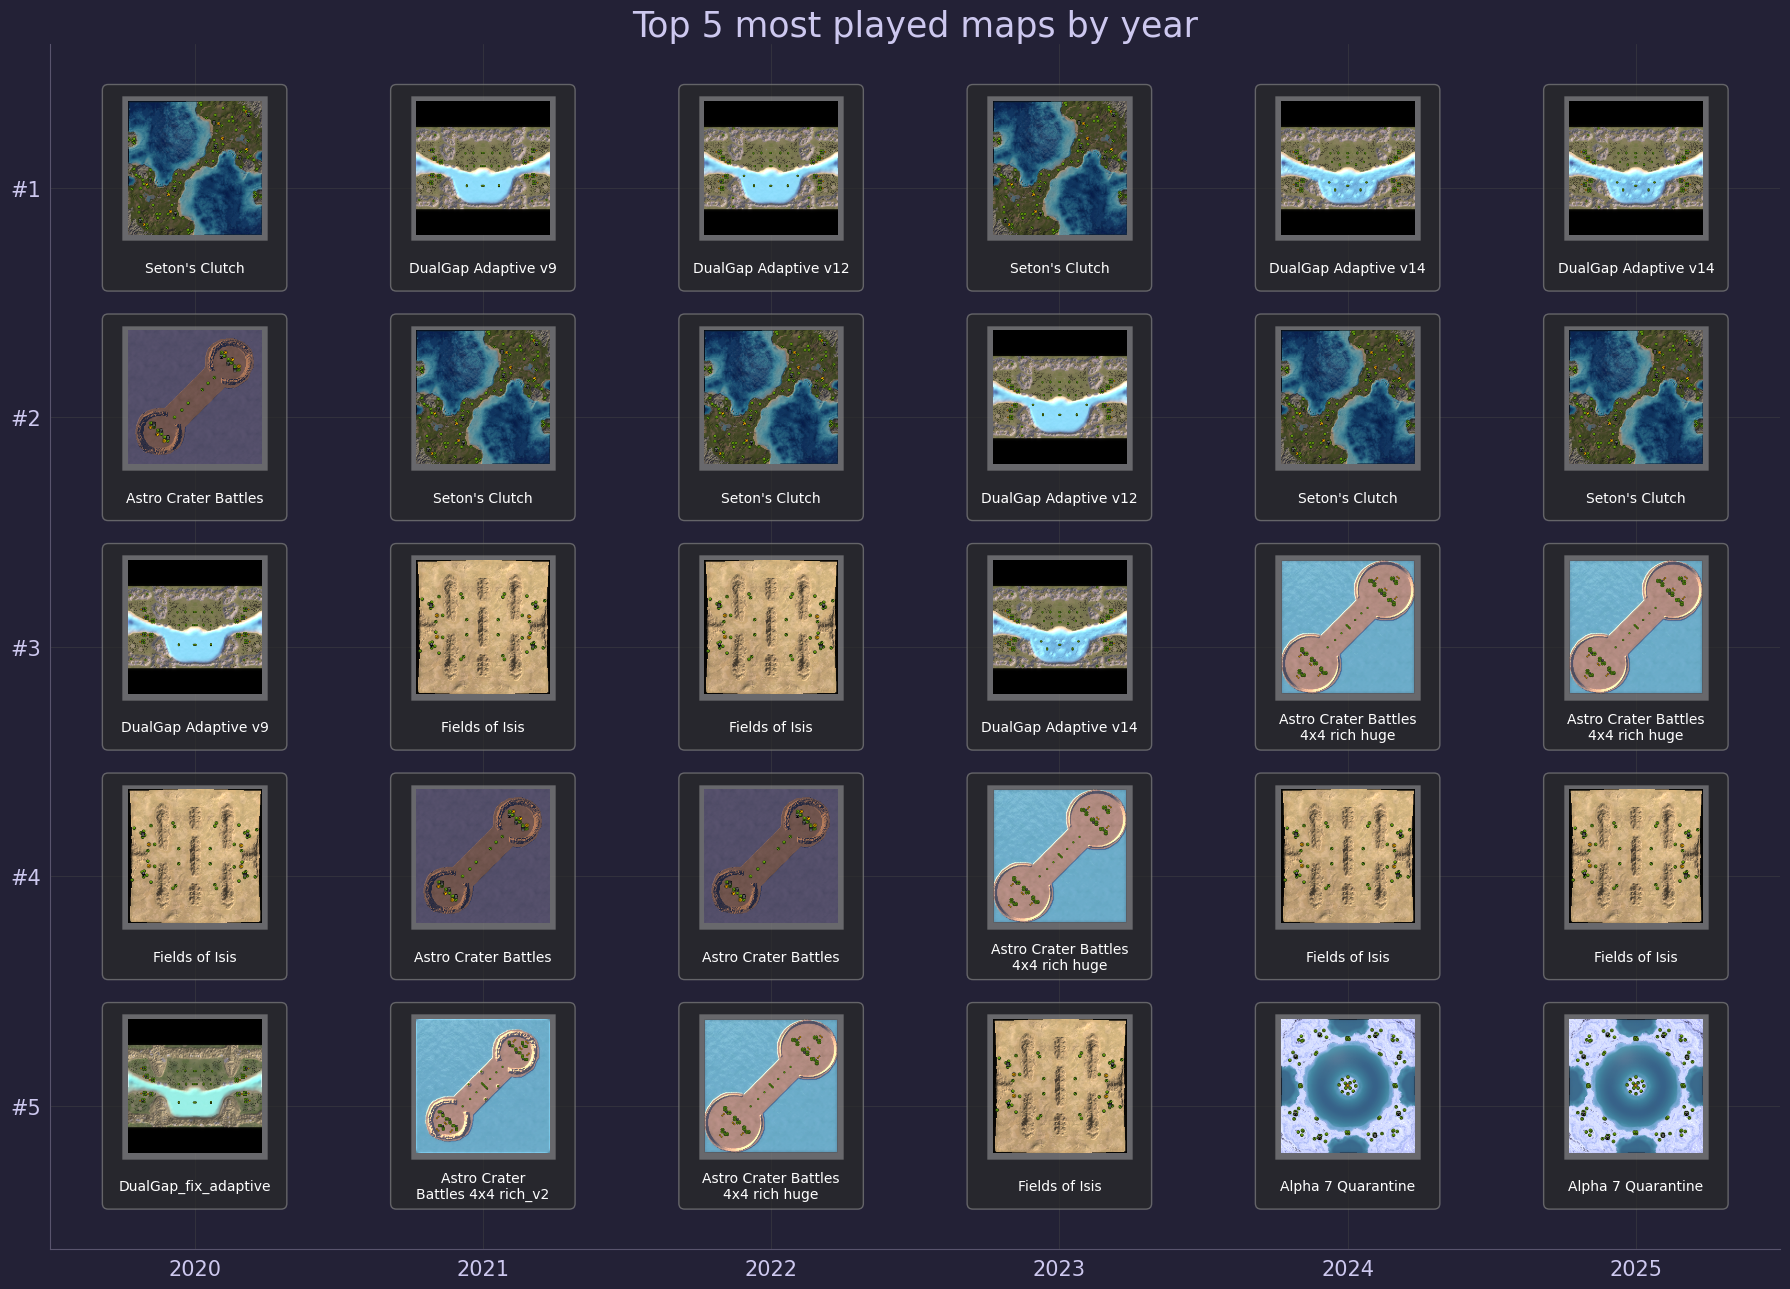
Fig. 10: Top 5 popular maps by year -
4.4 - Univariate analysis: Gameplayerstats
This chapter looks at the 'Gameplayerstats' dataset. Additionally, the 'LeaderboardRatingJournal' dataset was merged with this dataset, as it is essentially an extension of the GamePlayerStats dataset. Most importantly, merging these two datasets adds the 'leaderboard_id' variable to the GamePlayerStats data, which makes it possible to look at such things as ratings for specific leaderboards. These leaderboards include the Global, 1v1, 2v2, 3v3, etc. leaderboards.
This text was last updated on May 20, 2026.The size of the faf playerbase
Question: How large is the FAF playerbase?
In 2025 we saw a total of 68638 unique players.With the gameplayerstats records, we can count the number of unique players that played at least one game in a given year. The plot below shows these counts totalled per year for the years 2020 to 2025.
At our peak, in 2020, we had 84,909 unique players. Our worst year since 2020 was 2025, when we saw 68,638 unique players (-19.2%). Comparing 2025 to the previous year, we similarly saw a decrease from 74,436 to 68,638 (-7.8%). These numbers follow the general trend also seen in the decrease of the number of games and number of registrations in 2025 compared to 2024 and previous years.
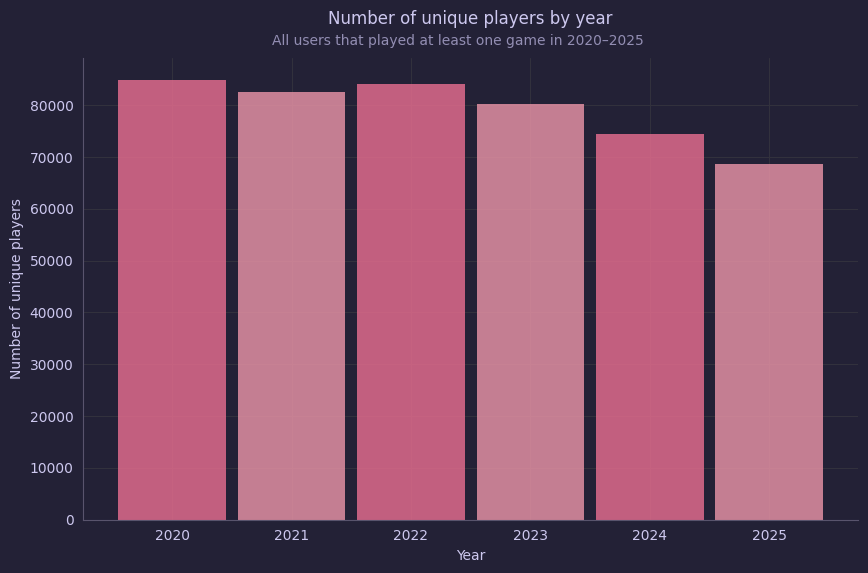
Fig. 1: Count of unique players per year for 2020-2025We know from the data analyses from previous years that many players only play a few games before they quit and never return. As a consequence, the yearly number of unique users gives us only a partial idea of the size of the playerbase. Players who started playing in January might already be gone in February, even while they still count to the yearly total. We can get a more precise understanding of the size of the FAF playerbase by looking at the monthly counts for these years. While we will take into account the specific number of games individual players play later, for now we will include all players that have played at least one game.
At our peak, in November 2020, we had 25,984 unique monthly players. Our worst month since 2020 was September 2025, when we saw 15,047 unique players. The average over these years was 20,393 unique monthly players. Comparing 2024 with 2025 shows the, by now expected, decrease: 2024 saw a monthly average of 19,043, while 2025 saw 17,127 (-10.1%). These numbers follow the general trend also seen in the decrease of the number of games and number of registrations in 2025 compared to 2024.
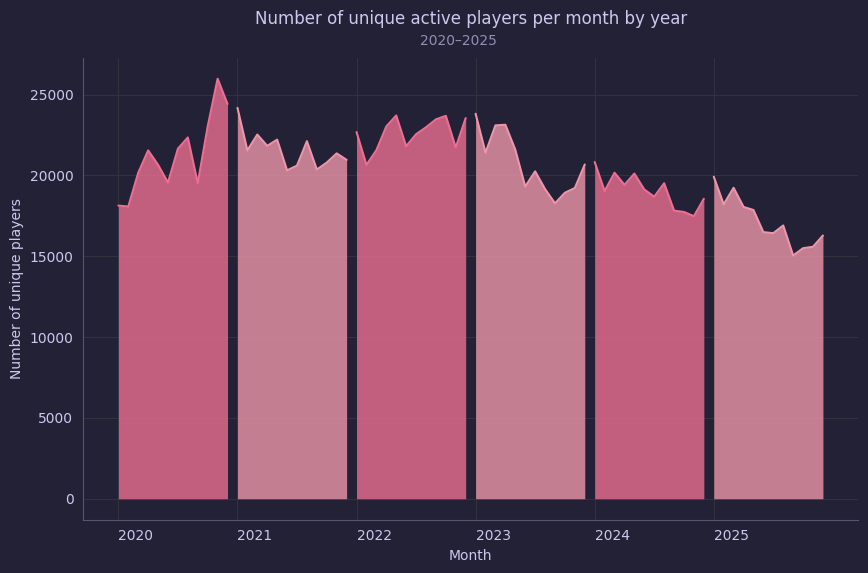
Fig. 2: Count of unique players per month for years 2020-2025A closer look at average games per player and the number of active players
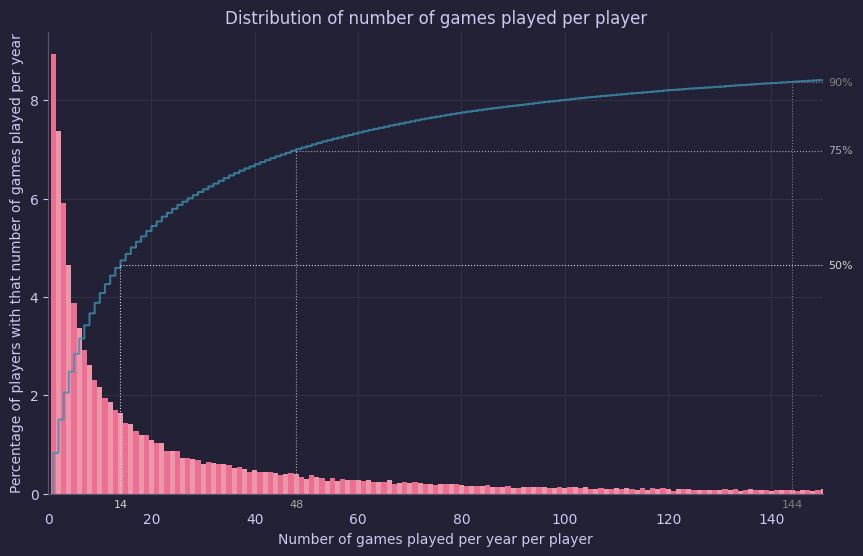
Question: How many games do players generally play every year?
There's a massive range. Some players play thousands of games, but half of all players active in 2025 played fewer than 15 games that year.There are several ways to measure player activity, each answering a different question. The two most natural measures are 'time played' and 'number of games played'. Both can be counted as a lifetime total since registration, or broken down by year to track how activity evolves over time.
The right measure depends on the question being asked. Time played is a better proxy for individual engagement and time investment: it tells you how much of a player's life went into the game. Number of games played is a better proxy for community presence and social activity: it reflects how often a player showed up and interacted with others.
For the purpose of understanding the size and health of the FAF playerbase, number of games per year is the more meaningful measure. It better captures the feeling of 'how busy is FAF from day to day' or 'how easy is it to find a game', because every game requires multiple players to be online and willing to play simultaneously. A player who played 100 games last year contributed 100 opportunities for other players to get a match, a metric that directly reflects the lived experience of being part of the community.
However, raw game counts span an enormous range across the playerbase. FAF has a classic long-tail distribution: a small number of highly dedicated players with thousands of games, a moderate core of regular players with tens to hundreds of games, and a large mass of casual or lapsed players with very few games. To understand this distribution, it helps to count how many players fall into each activity bracket. We can, for example, plot the proportion of players have played 1, 10, 100, 1,000, or 10,000 or more games in a given year.
This analysis is important because it allows us to define a meaningful activity cutoff: a minimum game count below which a player is considered inactive or lapsed for the purposes of a given analysis. We need such a cutoff matters because including completely inactive accounts (players who registered, played one game, and never returned) in metrics like 'active playerbase size' or 'rating distribution' would significantly distort the picture. After setting the cutoff, we can then have another look at the 'corrected' size of the playerbase.
The graph below shows the expected distribution: there is a decent chunk of players who play no more than a few tens of games and then not return. The exact distributions are relatively equal between the years, indicating that this is a stable behaviour pattern and not a reaction to external factors, such as intermittent DDOS/connection issues.
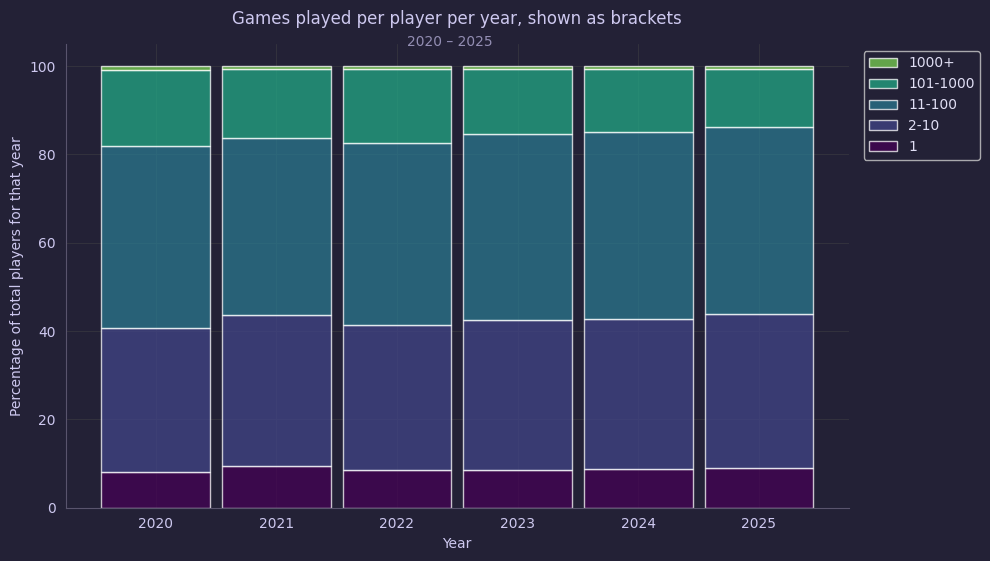
Fig. 3: Players binned by number of games played in that year. Bins stacked as percentage of the year total.The second graph below plots essentially the same data, but in a different way: it highlights how few games most players actually play. It turns out that any account with more than 100 games is already in the top 15% of most active players.
The practical implication is that the effective playerbase, the players who meaningfully contribute to the lobby/queue experience, is much smaller than the raw active player count suggests. If the median player plays 15 games a year and the mean is around 65 (see table below), a large fraction of the playerbase is effectively invisible to most other players. The community health, matchmaking quality, and lobby activity are driven almost entirely by the extreme right-side portion of the distribution: the players who play weekly or daily and who show up consistently enough to be a reliable presence.
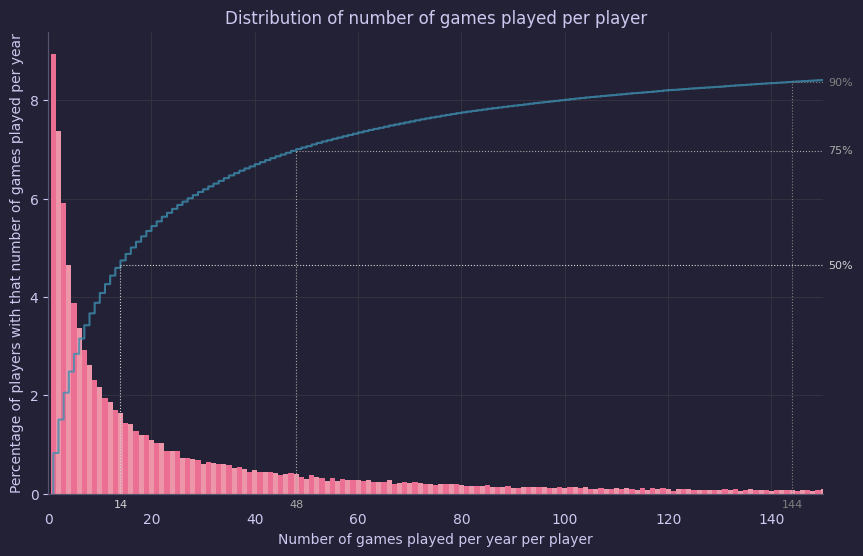
Fig. 4: More than three quarters of the players in 2025 have not played more than 50 games.In the table below, the median, mean, and max counts per year are noted. For 2025, the median number of games was 14.0. This means that half of all the players that played in 2025, played 14.0 or fewer games. The other half of the playerbase played more than 14.0 games. Because some players play a very large number of games (the largest number in 2025 was 4100 games), the average number of games (mean) is much higher: 62.4 in 2025.
The median and mean values has remained fairly stable since 2021, suggesting that player engagement has not changed meaningfully over time. That said, the numbers for the COVID year of 2020 are higher, as could be expected.
Table: Median, mean, and max values for the years 2020 to 2025.
year median mean max 2020 17.0 80.0 5615 2021 14.0 68.6 3650 2022 16.0 72.3 3277 2023 15.0 65.6 3815 2024 15.0 66.0 3978 2025 14.0 62.4 4100 An alternative way of looking at active players
The previous analysis showed that half of all players play 14 or fewer games. We could set this number of games as a cut-off for what we consider an active player. We can check whether or not this makes sense by comparing this with another way of measuring activty: the number of days a player plays at least one game. This would cover a weakness of the first approach, which treats a player who played 14 games in a single day identically to one who played one or two games every month throughout the year, despite these representing fundamentally different engagement patterns.
To capture the full picture, a tiered classification is here made based on the percentage of the days of the year the account is active. When calculating this number, the registration date for new accounts is taken into account: accounts created halfway through the year calculate their engagement as a percentage of the remaining time in that year.
Players who played fewer than 10% of the days (about a month's worth of days) are considered 'churned', which is a term commonly used to describe players who have since left the community. Players with a percentage between 10 and 40 are considered 'casual' players. Between 40 and 75 percent players are considered 'regulars'. Lastly, players who play 75-100% of all days of the year are the hard core of the community.
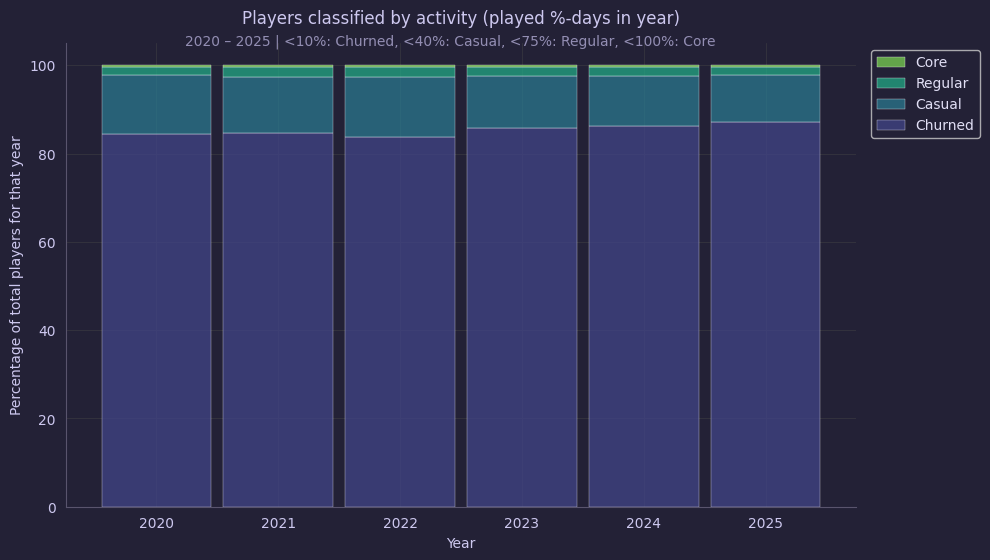
Fig. 6: Classification of players by activity in four tiers.Most of the playerbase has been binned as 'Churned': 87.1% of the playerbase played at most on 10% of days in the year available to them since registration.
In the 'Churned' group, 50% of players were active for only 4 or fewer days, and the average was not much higher at 7.3. In this time, these players had a median played number of games of 10, with a mean (average) of 22.2. This is worth repeating: 87.1% of all unique yearly players stay for no more than 4 days and play no more than 10 games, before quitting FAF. Even converting a fraction of these 59,814 players in 2025 alone would have a significant effect on the size of the FAF playerbase.
Looking at these numbers we can conclude that the cutoff of 14 games is at least vaguely in the right ballpark: The median and mean for the next category, the 'Casual' players, were at 182.0 and 228.7 respectively; a very different population, as can also be seen in the graph below.
In the graph below, the distribution for the number of games played per activity tier is plotted. It is worth nothing that while the way this graph is plotted might make it look like the 'Casual' group is at least somewhat similar sized, but this is not correct. The 'Churned' group contains more players than the other three together, six times over. Although the distributions show some overlap, the 'Churned' and 'Casual' tiers have clearly distinct distributions. The value for the earlier set cut-off value of 14 is marked on the x-axis. Also marked is the new cut-off value proposed based on these distributions, at 70 games played. This value covers the majority of players from the 'Churned' category, while barely removing any players from the 'Casual' tier.
Setting the cut-off makes sense for the context in which we need such a cutoff: when looking at statistics such as the average rating of the playerbase, players whose rating has not quite yet stabilized should not be included. We have to keep in mind, however, that this excludes a huge chunk of the total playerbase: 85.6%.
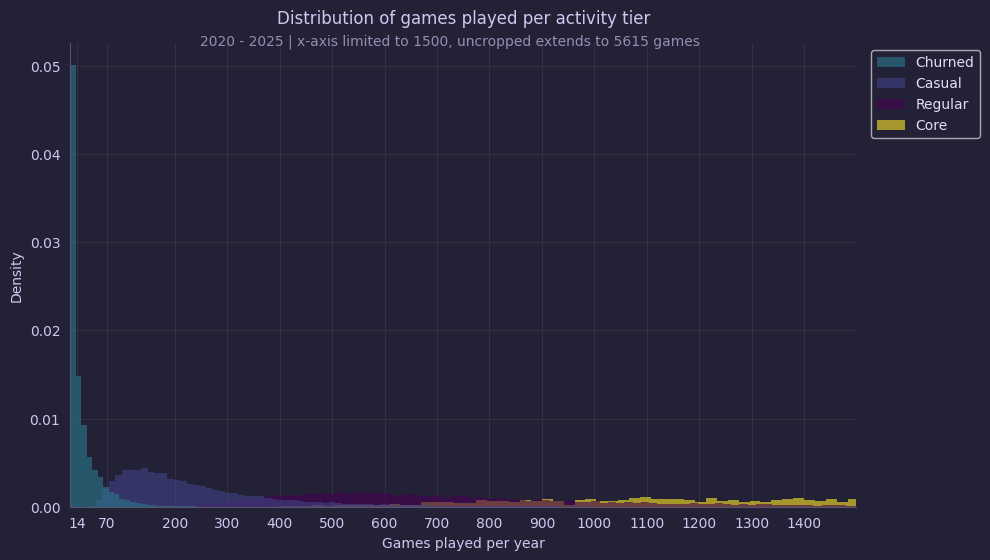
Fig. 8: The distributions for the number of games played per activity tier.Top 10 most active players in 2025 by game count and days played
We've looked a lot at the players who barely played, so here's a table with all those players who've played exceedingly often in 2025, to balance it out. This table shows two top-10 ranked lists; the left list shows the players ranked by percentage of the year they've played, the right the top-10 ranked by total number of games played.
In previous years, we had one or two players who played all days of the year. In 2025, however, the highest we've gotten is 99%. The number one, 'SiilentBug', played 360 of 365 days, four more than the runner up.
Table: The top 10 players ranked by percentage of days played on the left, and ranked by number of games played on the right
Rank by percentage of days played Username Percentage of days played Number of games played Rank by games played Username Percentage of days played Number of games played 0 SiilentBug 0.99 3240 0 Titaanbierdopje 0.69 4100 1 M83 0.98 2827 1 Babel- 0.93 3999 2 Moskito 0.97 1335 2 im_lagger 0.92 3412 3 Yew 0.97 2064 3 AKarmy01 0.71 3329 4 Flee 0.96 882 4 SiilentBug 0.99 3240 5 MrBlueMoon 0.96 2442 5 boss1100 0.91 3166 6 Firv 0.95 1904 6 up-and-down 0.61 3143 7 Rewer 0.94 2682 7 chucups 0.93 2891 8 TexasDeath 0.94 1929 8 plum- 0.88 2872 9 HY_R9 0.94 1123 9 totus-s 0.62 2834 Rating distribution for global leaderboard
Question: What does the rating distribution for the global leaderboard look like?
The median rating for all players that played at least one game between 2020 and 2025 was 534 on December 31st 2025.With the gameplayerstats records, we can get the latest update to the rating for each player that played at least one rated game. The first graph below looks only at the global leaderboard specifically, and only for the years 2020-2025, but includes all players from those years.
A few things can be noticed. First, the median rating is 534, which means that the on December 31st 2025, the rating for 50% of all players that played between 2020 and 2025 is below 534. This might be surprising, since 1000-rated players are often referred to as average. Instead, a 1000-rated player is already better than 84.2% of all players; well above average. Incidentally, the percentages for 1500- and 2000-rated players are 98.3% and 99.8%, respectively.
Looking at the graph, we see a noticeable spike for the '-100 to 0' ratings bin. As we'll see below, this spike almost entirely disappears when we use our previously set cut-off of 70 games to exclude churned and new players. This might indicate that people stop playing once they get negative rating, something that is likely to happen when a completely new player joins competitive lobbies and loses their first tens of games. Given the large number of players in this bin, having a better tutorial or onboarding system for new users may greatly benefit the size of our playerbase.
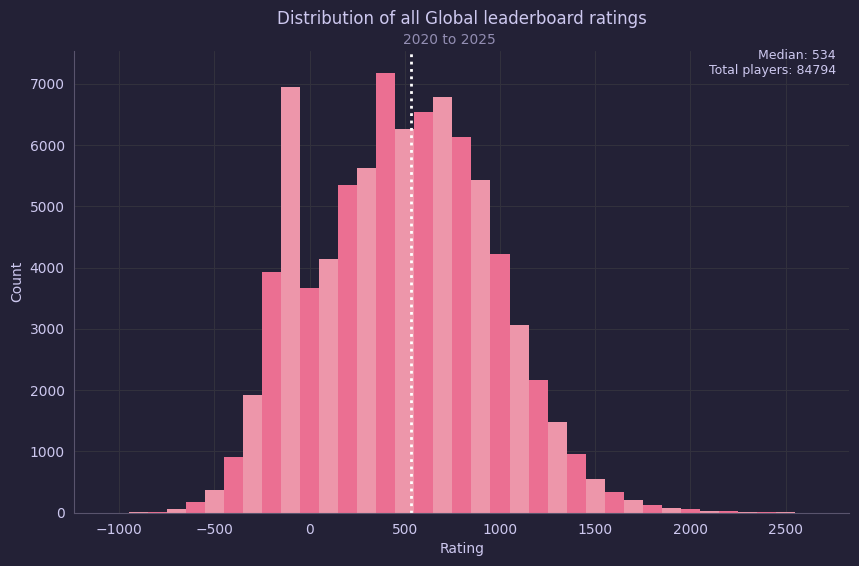
Fig. 10: Global leaderboard ratings as per December 31st 2025, for all players who played between 2020 and 2025. The median is 534.Rating distribution for global leaderboard
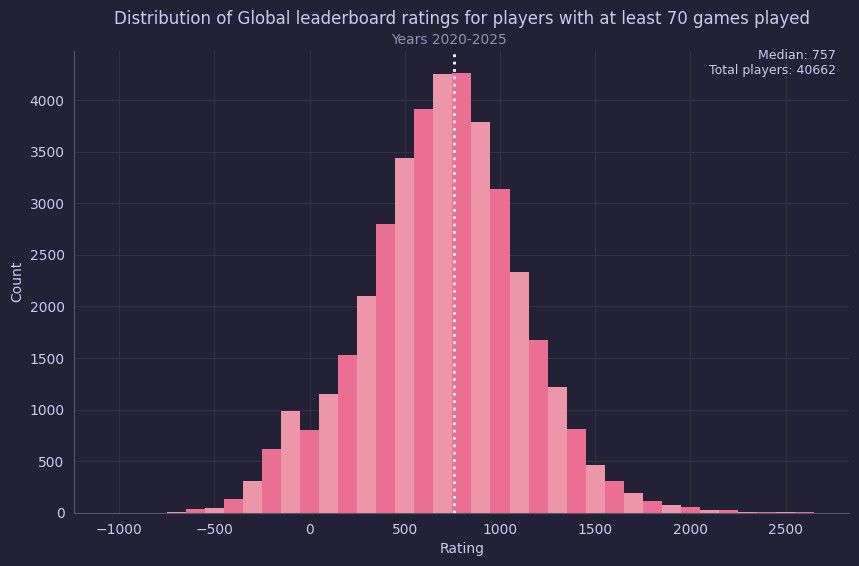
When we remove all players who haven't played at least 70 games from the dataset, the large spike in the -100 to 0 rating bin nearly disappears. This indicates that it is indeed the churned players who are responsible for this pike. The median also shifts, as expected: from 534 to 757. A comprehensive table of the data for both sets is shown below.
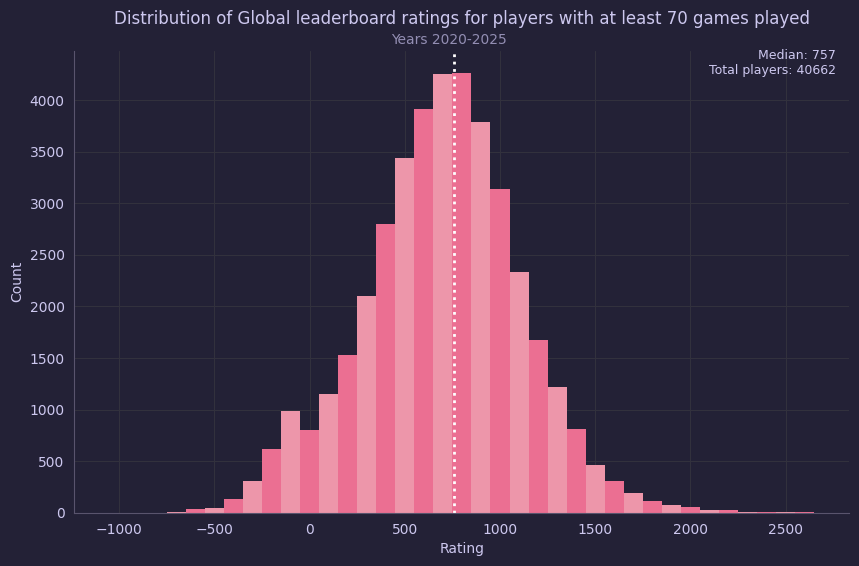
Fig. 11: Global leaderboard ratings as per December 31st 2025, for all players who played between 2020 and 2025. The median is 534.Table: Table with the general stats on the Global leaderboard ratings.
All players Non-churned players count 84794.00 count 40662.00 mean 531.09 mean 744.42 std 462.22 std 416.42 min -887.71 min -752.24 25% 179.16 25% 487.39 50% 533.84 50% 757.35 75% 860.39 75% 1008.80 90% 1118.67 90% 1251.32 95% 1280.67 95% 1406.77 96% 1332.70 96% 1450.55 99% 1614.99 99% 1756.44 99.5% 1763.22 99.5% 1909.90 99.8% 2000.73 99.8% 2137.49 max 2700.93 max 2700.93 Rating distribution for ladder leaderboards
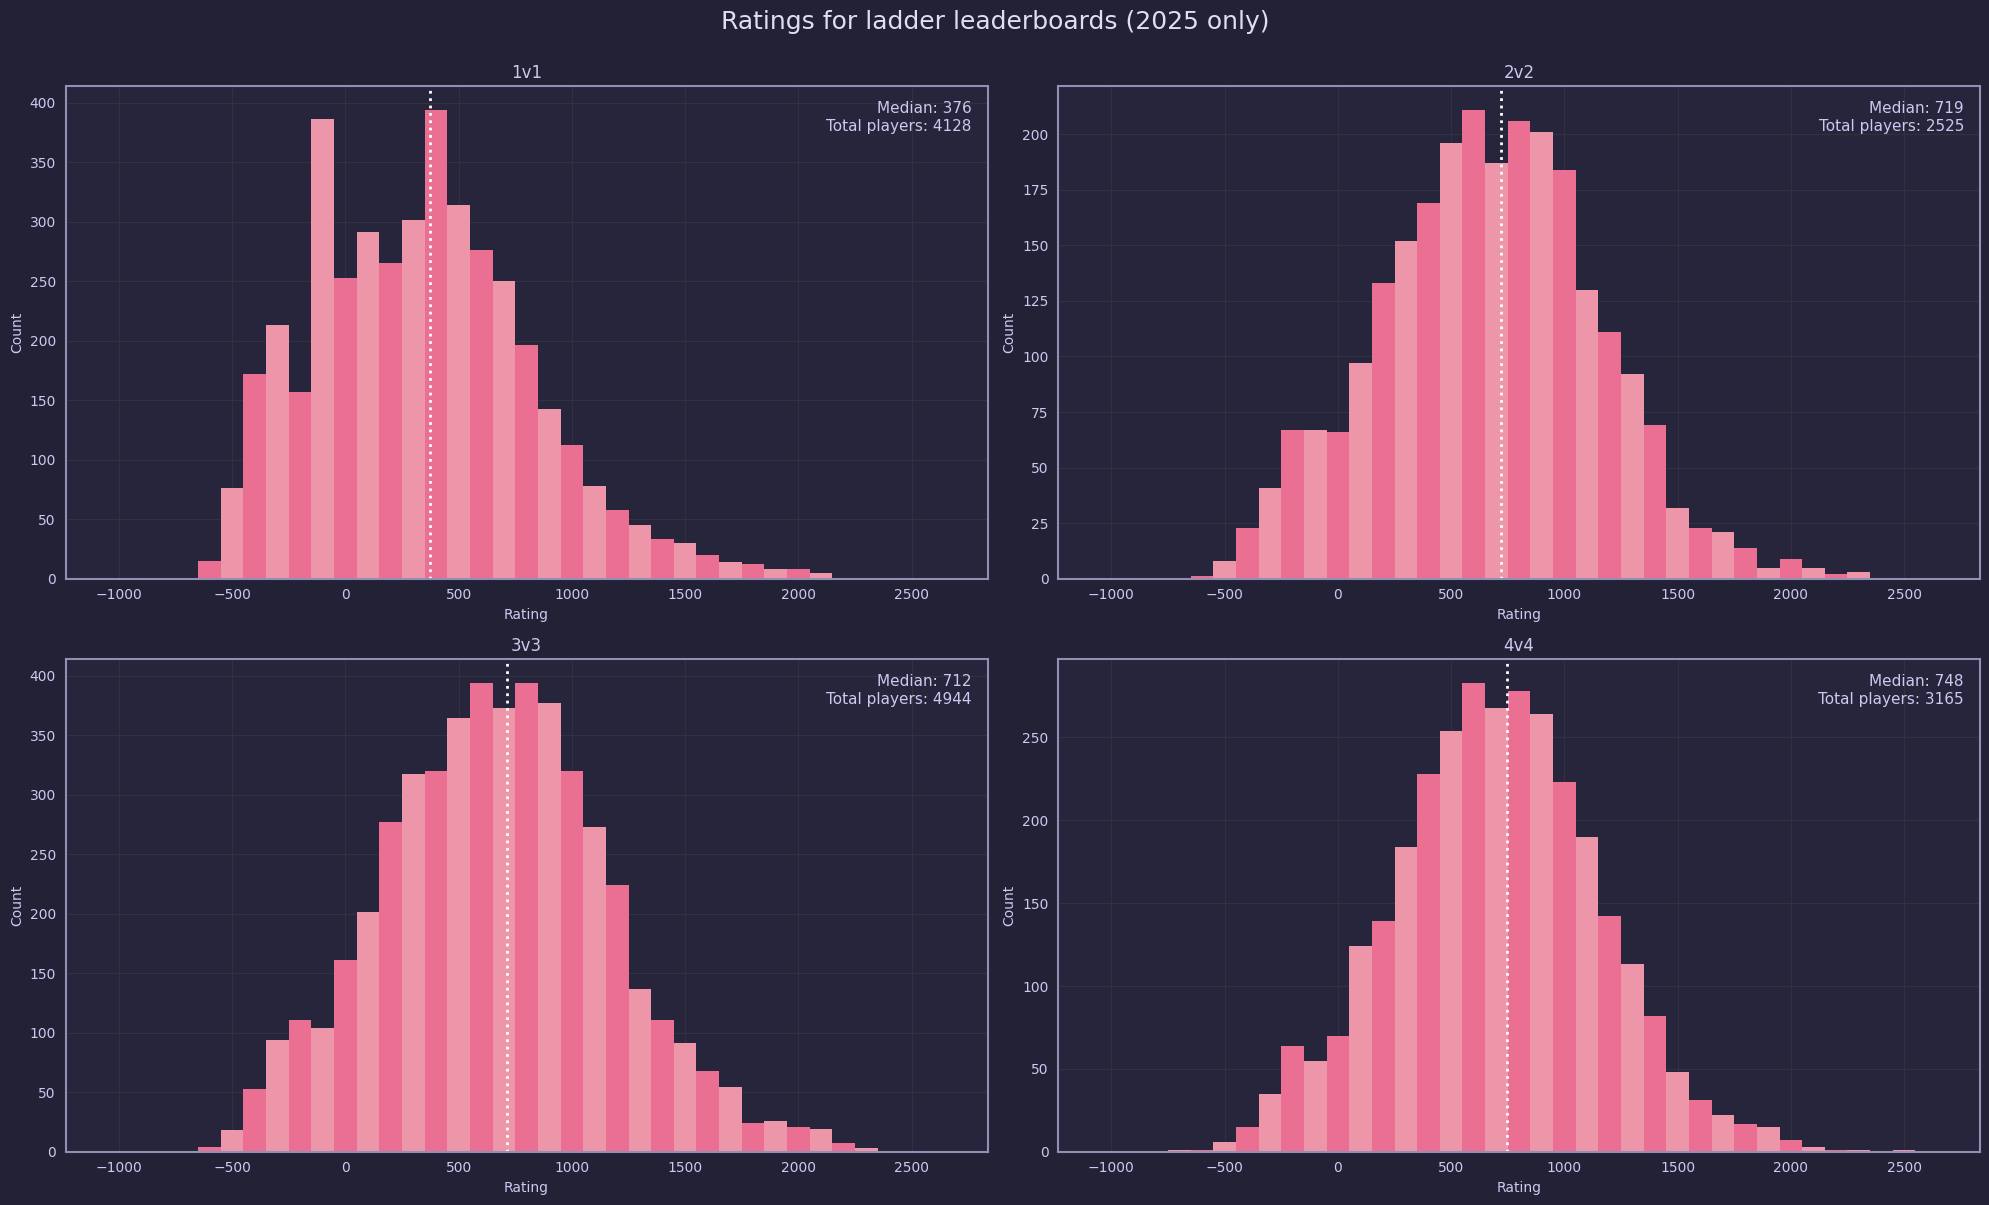
Question: Are the rating distributions for the ladder leaderboards similar to global, and to each other?
The 1v1 ladder's distribution differs from the rest. All of them have means that differ from the global leaderboard's mean.The ratings, as measured on December 31st 2025, for all players who played at least one game in 2025 were plotted. With the exception of the 1v1 bracket, which was 376, the medians for the ratings for the leaderboard was around 720-750. Given that the global uncorrected median was 534, the distributions for the global and ladder leaderboards differ significantly.
The data for the 1v1 bracket is more noisy than the other brackets, and the spikes at 500 and -100 might indicate that many players played only a few games, or stopped once their rating became negative, similar to the spikes seen in the global, uncorrected, rating distribution.
-
Work on this statistics project is paused due to real-life events. I've released this thread today with the work I've completed so far. Updates may follow, or they may not.
-
Thanks for the new statistics! As always, it's gorgeous!
-
Thanks! I took the opportunity to practice more with python. Building graphs from scratch gives a lot of freedom. I'm most happy about this one:
-
This is fantastic, thank you for putting this together!
-
Is there a list of highest rated players and their most frequently-played maps?
-
Would there be any stats on the highest ranked players throughout the years? Who was the highest rank ever, etc?

Hello! It looks like you're interested in this conversation, but you don't have an account yet.
Getting fed up of having to scroll through the same posts each visit? When you register for an account, you'll always come back to exactly where you were before, and choose to be notified of new replies (either via email, or push notification). You'll also be able to save bookmarks and upvote posts to show your appreciation to other community members.
With your input, this post could be even better 💗
Register Login