A small analysis of teams in TMM 2v2
-
Hello everyone, I've been part of this community for a while and I wanted to do something to showoff some interesting informations I find particulary relevant.
Since I am doing a small university project, I wanted to analyze a small dataset that would show a network of the various TMM 2v2 teams that play during a small slice of time, to see if there is anything special that stands out.
For this analysis I've picked up the TMM 2v2 tables from https://kazbek.github.io/FAF-Analytics/tmm2v2, specifically for the period of 30 days from 08/05/2022 to 07/06/2022 (Date is in D/M/Y format)
The data that was picked was:
- the player name, which was subsequently trasformed in an ID to anonymize the data
- the TMM 2v2 teams, which makes up the connection between the nodes
- the player TMM 2v2 rating
- the player TMM 2v2 most played faction
For the availability of this data I want to thank the FAF team for allowing me usage of this data and @Kazbek, for the amazing tool that he created.
So, let's start with the first graph
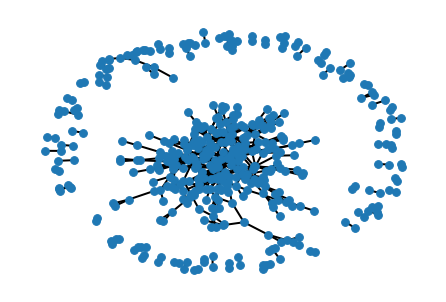
From this first view, the thing that strikes out the most is the structure of this graph, which is called a core-periphery structure, where near the center there is a thightly connected graph and around it a bunch of other small networks.
This already gives and idea of the types of groups present in TMM 2v2, some players only play TMM with another person or they just play it once, while others play with multiple friends or just enter matchmaker alone.
But, let's also see the faction and the rating distribuition
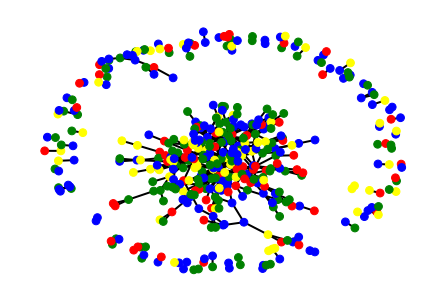
This is the faction graph, where each node is colored with their respective faction, so:
- blue -> UEF
- red -> Cybran
- green -> Aeon
- yellow -> Seraphim
At a quick glance, there isn't an overall most played faction, and most of the distribuition seems equal between all the factions, maybe with both aeon and uef having more picks than cybran and seraphim
Another note is that in the periphery there are teams that play mostly the same factions, being just a small amount of the overall selection.
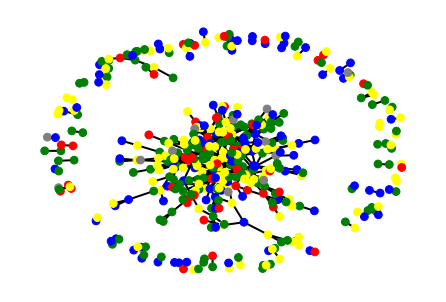
This is the rating graph, where each node is colored with the respective rating bracket, so:
- rating < 200 -> red
- 200 <= rating < 700 -> yellow
- 700 <= rating < 1200 -> green
- 1200 <= rating < 1700 -> blue
- 1700 <= rating -> grey
As we can see, much of the graph is not uniform, there aren't many areas with same colors around the nodes and rating is not confined to a specific zone only, and the fact that some of the periphery networks do contain high rated nodes, which would confirm the fact that there are teams which do not search divided for a match
Thank you all for reading through, if you have question feel free to ask me anything.
-
Could you tell us more about how you made the graph?
")
-
Of course, my bad for not explaining it in detail
So, from 2 tables in https://kazbek.github.io/FAF-Analytics/tmm2v2, the Most active TMM 2v2 teams table and the Most active TMM 2v2 players, I have extracted from each table respectively the Players in Teams table and the Player name, the rating and their most played faction from the players table
From this I have generated for each player an ID, then created 2 files (CSV format) to keep the information of the rating and the most played faction sourced from the players table, so pairs of [PlayerID, Rating] and [PlayerID, MPF]
Then I have generated another file (CSV format) that rappresents an edge list with each line having a pair of values [PlayerID, PlayerID], in this case the PlayerIDs sourced from the Teams table, that explain the connection between players, or to say it differently the team composition.
All of this files are then read by a python file using the networkx package, which is a library to create manipulate and study graphs, with which I loaded the graph from the edge list, and then coloured with the other pairings to get these graphs.
-
@raquaza would u be willing to share the csvs?
-
Sure, here they are
Just a small note on the last CSV file, it is not in CSV format, since it's just for each line IDs divided by a single space, so you'll need to rename the extension to .edges, because I used the function networkx.read_edgelist ('filePath', nodetype=int) to import the data correctly for the graph format.
-
Awesome thanks
-
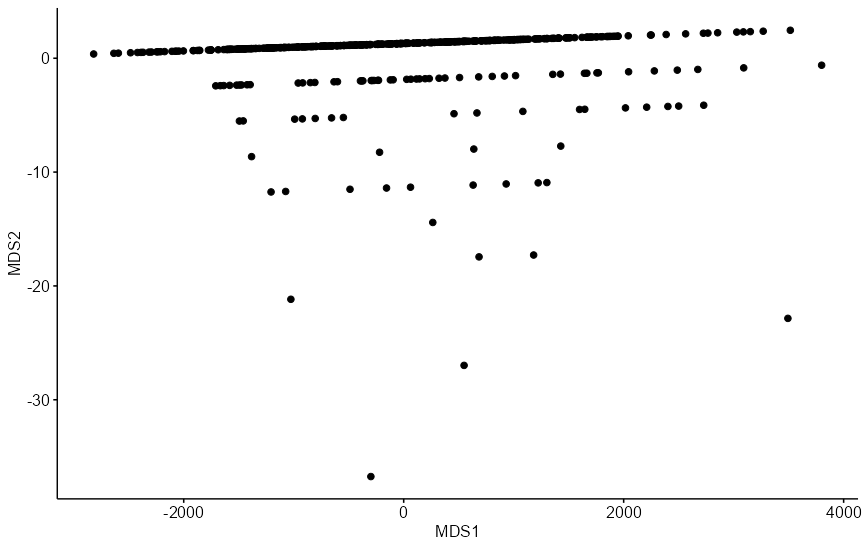
@spikeynoob If you're interested, you can copy paste the table into R with datapasta. It's shockingly easy and then save it to a text file or something.
I tried doing some fancy MDS but nothing interesting came out lol.
Hello! It looks like you're interested in this conversation, but you don't have an account yet.
Getting fed up of having to scroll through the same posts each visit? When you register for an account, you'll always come back to exactly where you were before, and choose to be notified of new replies (either via email, or push notification). You'll also be able to save bookmarks and upvote posts to show your appreciation to other community members.
With your input, this post could be even better 💗
Register Login